Download
1 / 5
50 likes | 64 Views
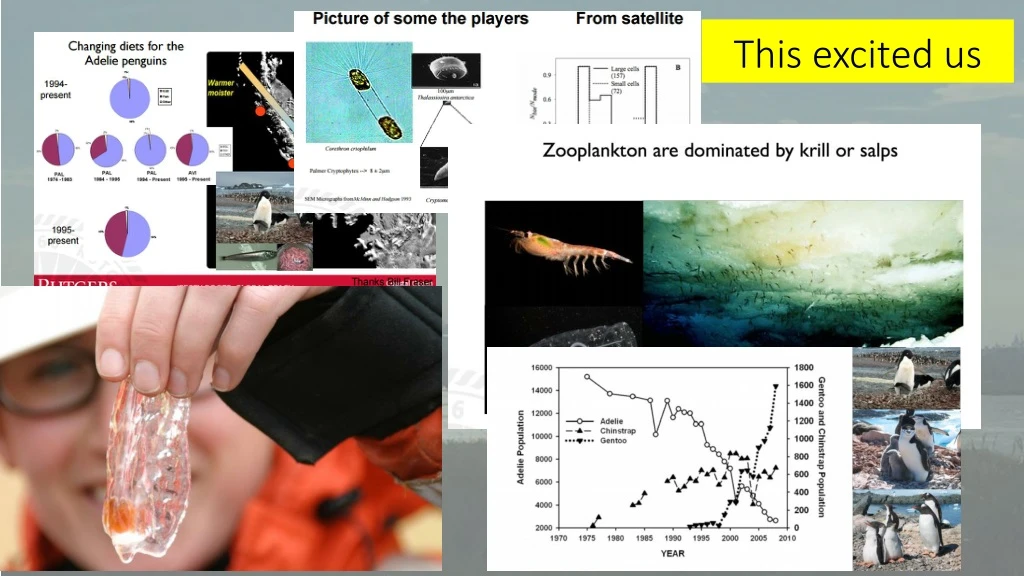
Dive into the dynamics of penguin populations with this hands-on activity using real scientific data. Students will analyze competition and predator-prey relationships among Adelie, Chinstrap, and Gentoo penguins from 1974 to 2010. Utilize XCel Spreadsheet software to create graphs illustrating population changes. Dataset provided.

E N D
THANKS Joanne for our background picture!!!!! Are Adelies getting the “Cold Shoulder” https://www.youtube.com/watch?v=uGwH-x4VoH8 47 seconds in
SUMMARY This activity allows students to use real scientific data to explore ecosystem dynamics; including competition and predator-prey relationships among three Antarctic penguins. Students will manipulate data using XCel Spreadsheet software to generate a graph to illustrate population changes observed in Adelie, Chinstrap, and Gentoo penguins between 1974 and 2010. A dataset for each species is provided. The penguin population and penguin diet datasets were collected in the Palmer Station Study region, which is part of the Long-Term Ecological Research program. This program began in 1992 and has been collecting annual data in this region (as well as numerous other regions in Antarctica) on a variety of ecological interactions.