Download
1 / 12
120 likes | 311 Views
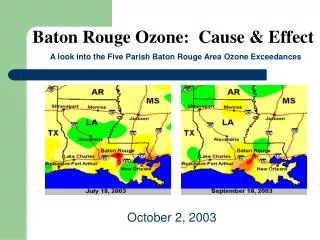
Baton Rouge VOC, NOx, Ozone Data Analysis Overview. October 22, 2003 Mark Sather, U.S. EPA Region 6, Air Quality Analysis Section E-mail: sather.mark@epa.gov Phone: (214) 665-8353.

E N D
Baton Rouge VOC, NOx, OzoneData Analysis Overview • October 22, 2003 • Mark Sather, U.S. EPA Region 6, Air Quality Analysis Section • E-mail: sather.mark@epa.gov • Phone: (214) 665-8353
In both Baton Rouge and Houston significant decreases in ambient VOC concentrations and O3 concentrations occurred between the late 1980’s and early 1990’s • Ambient NOx concentrations have not significantly declined from 1985-2002
Both Stationary Sources and Mobile Sources are major contributors to ambient VOC and NOx concentrations in Baton Rouge as seen by sector analysis. • NW sector –higher VOC; SE sector – higher NOx
Recent Speciated VOC Trends in Baton Rouge and Houston • For ethylene, propylene, and 1-butene, all important HRVOC, concentrations at the Baton Rouge Capitol site have recently risen to concentrations recorded at the Houston Clinton Drive site. • Ethane, toluene, and benzene concentrations similar between the two sites. • Both sites show recent decreases in concentrations for m/p xylene and m-ethyltoluene.
Baton Rouge 1-hour Ozone Exceedance Days Breakdown • From 1995-2003 about 25% of 1-hour ozone exceedance days exhibit a rapid rise of ozone during the exceedance hour. • This is a similar percentage to what has been seen historically in Lake Charles, Longview, Beaumont • El Paso=40%, Houston=50%, DFW=0%
Breakdown of 1-hour ozone exc. days Area Years # transient % # rapid rise w/out quick rapid fall % All others % Houston 1999-2001 16 14.2 40 35.4 57 50.4 El Paso 1992-2001 1 4.0 9 36.0 15 60.0 Beaumont 1992-2001 1 3.2 7 22.6 23 74.2 Longview 1990-2001 1 5.0 4 20.0 15 75.0 Baton Rouge 1995-2003 2 3.9 11 21.6 38 74.5 Lake Charles 1991-2001 0 0.0 4 22.2 14 77.8 DFW 1994-2001 0 0.0 0 0.0 63 100.0
Summary • Baton Rouge experienced its greatest decline in ozone concentrations from the late 1980’s to the early 1990’s, concurrent with major decrease in ambient VOC concentrations. • From 1995-2003 about 25% of 1-hour ozone exceedances exhibited “rapid rise” (>40 ppb) of ozone just before the exceedance hour; 2 “rapid rise” days apiece in 2002 and 2003. • Overall VOC concentrations have not decreased from the mid 1990’s to 2002, and NOx concentrations have been steady from 1985-2002. • Overall VOC concentrations at the Capitol site are a little lower than the similarly located Clinton Drive site in Houston, but some HRVOC like ethylene and propylene have recently risen at the Capitol site to concentrations seen in Houston. • The Capitol site is a very good site to measure peak VOC/NOx from both stationary and mobile sources in central and north Baton Rouge; future PAMS rule changes will result in more measurements being taken at the Capitol site. • Other 2 PAMS sites mainly measure north and south boundary conditions for Baton Rouge area; if additional precursor monitoring is undertaken in the future, areas for consideration could be in Ascension and Iberville parishes close to the significant cluster of stationary sources.