Download
1 / 33
350 likes | 539 Views
Union PACIFIC CORPORATION October 24, 2013. Alex Johansson, Dan Kleeman & Qianwen Wu. Agenda. Introduction Macroeconomic Outlook Industry Overview Company Overview Earnings Report Financial Analysis Valuation Recommendation. Macroeconomic Outlook. Increasing Growth of Shale Sands

E N D
Union PACIFIC CORPORATIONOctober 24, 2013 Alex Johansson, Dan Kleeman & Qianwen Wu
Agenda • Introduction • Macroeconomic Outlook • Industry Overview • Company Overview • Earnings Report • Financial Analysis • Valuation • Recommendation
Macroeconomic Outlook • Increasing Growth of Shale Sands • Emerging Market in South • Inbound – Frac Sand & Pipe • Outbound – Crude Oil • Increasing U.S. Population Base • Stimulate Long-Term Growth Source: 2012 10-K (Pg. 2)
Macroeconomic Outlook • Keystone XL Pipeline • Proposed Pipeline to Relieve Bottleneck Supply in Canada • Numerous Environmental Concerns • Recent News • Permit Denied January 2013 • Increasing Doubt of Completion • No Decision Probably Till 2014 Source: Wall Street Journal
Macroeconomic Outlook Industry Catalysts • Automotive • Largest Automotive Carrier West of the Mississippi • Chemical – Shale Commodity Group • Emerging Market – Offsets Decreased Coal Growth • Coal • Coal Made Up 20% of 2012 Revenues • Decreased Growth Domestically – EPA & President Obama Proposals • Indirect Growth Relationship w/Natural Gas Prices • Decreased Growth In Imports To China • We Proposed Minimal Growth In Our Model Source: Wall Street Journal, 2012 10-K (Pg. 5 &23)
Industry Forces Analysis • Threat of Substitutes: High • Other Alternatives Include Transportation Via: River Barge, Trucking & Pipeline (Keystone XL) • Bargaining Power of Buyers: Medium • Few Competitors • Many Alternatives • Threat of New Entrants: Low • Very Capital Intensive High Barriers of Entrance • Geographic specificity
Industry Forces Analysis • Bargaining Power of Suppliers: High • Very Little Pricing Power Over Fuel • Few Suppliers of Trains and Rail Supplies • Switching Cost May Be High • Rivalry among Competitors: Medium • Limited Amount of Competitors • Specific to Service & Geographic Region
Comparison between Dow Jones Railroad Index and S&P 500 Source: Google Finance
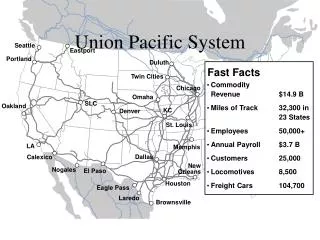
Company Overview Source: Union Pacific Website
Company Overview – Commodity Group Breakdown • Agricultural - Grains, Food & Beverage • Revenue Decrease 2% • Volume Decrease 4% With 2% Increase in Average Revenue/Car • Coal - Coal & Petroleum Coke • Revenue Increase 2% • Volume Decrease 8% With 10% Increase in Average Revenue/Car • Intermodal - International and Domestic Container Traffic • Revenue Flat & Volume Decrease 1% With 2% Increase in Average Revenue/Car Source: 2013 3rd Quarter 10-Q (Pg. 23)
Company Overview – Commodity Group Breakdown • Chemical - Petrochemical, Shale & Fertilizer • Revenue Increase 5% • Volume Decrease 3% With 2% Increase in Average Revenue/Car • Industrial Products - Construction Products, Metals, Minerals, Paper Consumer Goods, Etc. • Revenue Increase11% • Volume Increase 9% With 2% Increase in Average Revenue/Car • Automotive - Finished Vehicles & Automotive Parts • Revenue Increase 17% • Volume Increase 8% With 9% Increase in Average Revenue/Car Source: 2013 3rd Quarter 10-Q (Pg. 23)
Company Overview – Revenue Breakdown • 9 Months Ended September 2013 Source: 2012 10-K (Pg. 5), 2013 10-Q (Pg. 8)
Business Risk Analysis • Seasonality • Agricultural Product (Harvesting Seasons) and Intermodal (Peaks During 4th Quarter Holiday Season) • Competition • Other Railroads, Motor Carriers, Ship and Barge Operators and XL Keystone Pipeline • Fluctuation of Fuel Cost • Minimal Pricing Power - Fuel Surcharge vs. Busines • Key Suppliers • 2 Suppliers For Horsepower Locomotive & Rail Purchases Source: Union Pacific 2012 10-K (Pg. 6 & 11)
Business Risk Analysis • Union Workers • 86% of Employees Are Members of One of 14 Major Rail Unions • Dependence on Technology • Maintain Newest Technology vs. Competitors • Railroad Security • Required to Transport Hazardous Materials • Environmental Regulation • Significant Costs to Investigate and Mitigate Environmental Contamination • Weather Changes Source: 2012 10-K (Pg. 6, 7, 8, 10)
SWOT Analysis Source: Marketline UNP Report
Strategy Focusing on Creating Value for Our Customers By Providing Safe, Efficient and Reliable Services. • Continued Capital Investment to Support Long-Term Functionality • Expand Network in the South • Increase Shale Related Presence • Maintain a Diverse Franchise of Operations Source: Union Pacific 2013 10-Q (Pg. 15), 2012 10-K (Pg. 2)
Management Outlook • Positive • 2012 Performance Reaches All-Time High • Diversified Portfolio of Business Providing Hedging Against Each Other • Invest Intensively in Technology and Equipment Enhancement • Growth in the Southern Region of the Network (Shale-Related Energy Arena) • Increase in U.S. Population Base • Concerns • Fuel Price Fluctuation Source: 2013 3rd Quarter 10-Q (Pg. 15, 22), 2012 10-K (Pg. 2)
Recent News – Earnings Report • Earnings Report – October 17, 2013 • Record Quarterly Earnings of $2.48/Share From $2.19 2nd Quarter • Net Income Increased to $1.2B From $1.0B • Dividend Declared $0.79/Share • Record Quarterly Operating Margin of 64.8% • Flat Volumes With Increase in Core Pricing Power Source: Union Pacific Website News Releases
Recent Financial Information Source: Union Pacific 2012 10-K (Pg. 20)
Recent Financial Information Source: Union Pacific 2012 10-K (Pg. 20)
Current Stock Information Source: Yahoo Finance
Financial Analysis Source: Capital IQ
Financial Analysis Source: Capital IQ
Stock Performance Source: Yahoo Finance
Comparable Company Analysis Source: Capital IQ
Comparable Company Analysis Source: Capital IQ
Discount Rate Source: Capital IQ
Discount Rate Source: Capital IQ
Decision Drivers • Strengths • Record Operating Margin of 65% • Record Quarterly Earnings of $2.48/Share & Record Quarterly Dividend of $0.78/Share • Industry Diversification – Growth of Shale • Automobile Industry Resurgence • Concerns • Decrease in Coal Growth • Crude Oil Fluctuations Source: Union Pacific Website News Releases, 2012 10-K (Pg. 2)
Recommendation • Valuation Summary • Current Stock Price: $154.90 Per Share • Comparable Companies Valuation: $182.51 Per Share • DCF Valuation: $151.67 per share • Recommendation: HOLD • Diversified Competitive Position • Stock is Fully Valued • Positive Macroeconomic Outlook