Download
1 / 14
140 likes | 237 Views
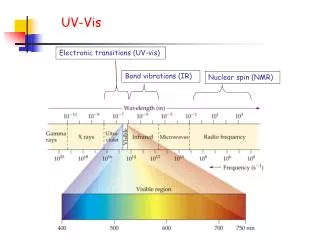
UV-vis data and NORS validation server. F. Hendrick, B. Langerock, M. Van Roozendael, and M. De Mazière. Belgian Institute for Space Aeronomy (IASB-BIRA), Brussels, Belgium. NORS/NDACC UV-VIS meeting, Brussels, 3-4 July 2012 1. Context.

E N D
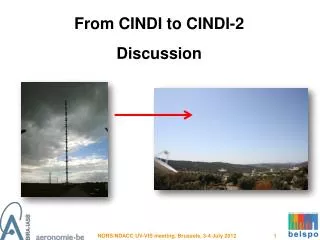
UV-vis data and NORS validation server F. Hendrick, B. Langerock, M. Van Roozendael, and M. De Mazière Belgian Institute for Space Aeronomy (IASB-BIRA), Brussels, Belgium NORS/NDACC UV-VIS meeting, Brussels, 3-4 July 2012 1
Context • To develop and implement a web-based application for validation of MACCII products using the NORS data products (NORS WP8) MACC output at 0, 6, 12, 18, 24h UT NORS/NDACC UV-VIS meeting, Brussels, 3-4 July 2012 2
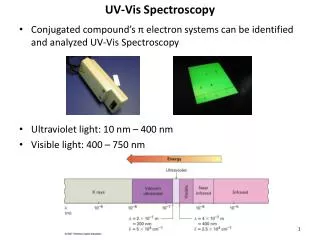
1. Temporal interpolation • For UV-vis data, three different cases need to be considered: • Total ozone columns (90° SZA AM and PM) • Stratospheric NO2 columns and profiles (90° SZA AM and PM) + diurnal variation • Products from MAX-DOAS observations (every ~30’) NORS/NDACC UV-VIS meeting, Brussels, 3-4 July 2012 3
Temporal interpolation: total ozone • Choose a characteristic time-window (e.g., 6h as for FTIR): MACC output 6h 6h Time 90°SZA AM observation 90°SZA PM observation NORS/NDACC UV-VIS meeting, Brussels, 3-4 July 2012 4
Temporal interpolation: stratospheric NO2 90°SZA PM 90°SZA AM MACC-II output Scaling factor x_MACCII(LTDOAS) = x_MACCII (LTMACCII) . [ x_model(LTDOAS)/x_model(LTMACCII) ] with x= NO2 VCD or [NO2] at altitude z NORS/NDACC UV-VIS meeting, Brussels, 3-4 July 2012 5
NORS NO2 photochemical correction tool • ‘Off-line’ calculation of look-up tables of NO2 profile diurnal variation using of the BIRA photochemical box model PSCBOX • Model calculations for the following scenarios: altitude (24 levels), latitude (18 values covering 85°N→85°S by 10° step), longitude set to 0, months 1-12 • For each month, use of the SLIMCAT chemical and meteorological fields corresponding to the middle of the month averaged over a period of 10 years (2000-2009) • Look-up tables of NO2 profile diurnal variation in ASCII • Creation of an interpolation routine in FORTRAN to extract the needed scaling factors NORS/NDACC UV-VIS meeting, Brussels, 3-4 July 2012 6
Sensitivity tests (1) March 15th chemical field and p, T profiles averaged over 10 years (2000-2009) NO2_model(LTDOAS) / NO2_model(LT) March 15th 2000 NORS/NDACC UV-VIS meeting, Brussels, 3-4 July 2012 7
Sensitivity tests (2) March 15th chemical field and p, T profiles averaged over 10 years (2000-2009) NO2_model(LTDOAS) / NO2_model(LT) March 15th 2005 NORS/NDACC UV-VIS meeting, Brussels, 3-4 July 2012 8
Sensitivity tests (3) denoxification NORS/NDACC UV-VIS meeting, Brussels, 3-4 July 2012 9
NORS NO2 photochemical correction tool • ‘Off-line’ calculation of look-up tables of NO2 profile diurnal variation • Use of the photochemical box model PSCBOX • Model calculations for the following scenarios: altitude (24 levels), latitude (18 values covering 85°N→85°S by 10° step), longitude set to 0, months 1-12 • For each month, use of the SLIMCAT chemical and meteorological fields corresponding to the middle of the month averaged over a period of 10 years (2000-2009) • For polar regions in late fall, winter, early spring, additional look-up tables are needed for denoxification conditions; the choice of LUTs (denoxification conditions or not) could be based on the measured NO2 columns NORS/NDACC UV-VIS meeting, Brussels, 3-4 July 2012 10
Temporal interpolation: MAX-DOAS products • Smaller time-window due to the strong short-term variation: 1h 1h MACC output Time MAX-DOAS observations (every ~ 30’) NORS/NDACC UV-VIS meeting, Brussels, 3-4 July 2012 11
2. Spatial interpolation • As for FTIR, calculate the location of the effective airmass of every measurement • Interpolate the four surrounding MACC-II model data to this effective airmass location: Is it relevant to proceed like this with UV-vis measurements ? Do we have tools for such calculations ? NORS/NDACC UV-VIS meeting, Brussels, 3-4 July 2012 12
3. Smoothing and vertical gridding Profile comparisons: • MACC-II profile xMACC must be regridded to the vertical grid of the NORS profile • The MACC-II data is smoothed with the averaging kernel of the NORS measurement using: • xs,MACC = xa,NORS + ANORS (xMACC – xa,NORS) • IF DOFS < 5, one defines partial column boundaries in between which there is about one DOF. Partial column boundaries should be defined by the PI of the instrument NORS/NDACC UV-VIS meeting, Brussels, 3-4 July 2012 13
3. Smoothing and vertical gridding Column comparisons: • MACC-II profile xMACC must be regridded to the vertical grid of the NORS profile • The MACC-II data is smoothed with the column averaging kernel of the NORS measurement using: • Cs,MACC = Ca,NORS + (xMACC – xa,NORS) • Suitable for OEM-based retrievals but what we do for total ozone and stratospheric NO2 column retrievals (no a priori data used) ? NORS/NDACC UV-VIS meeting, Brussels, 3-4 July 2012 14