Download
1 / 4
40 likes | 112 Views
Investigate primary sources of evidence on fires in West Arnhem Land from 1990-2007 through detailed fire scar maps and graphs. Compare extent and changes over the years to understand the seasonal trends and types of fires.

E N D
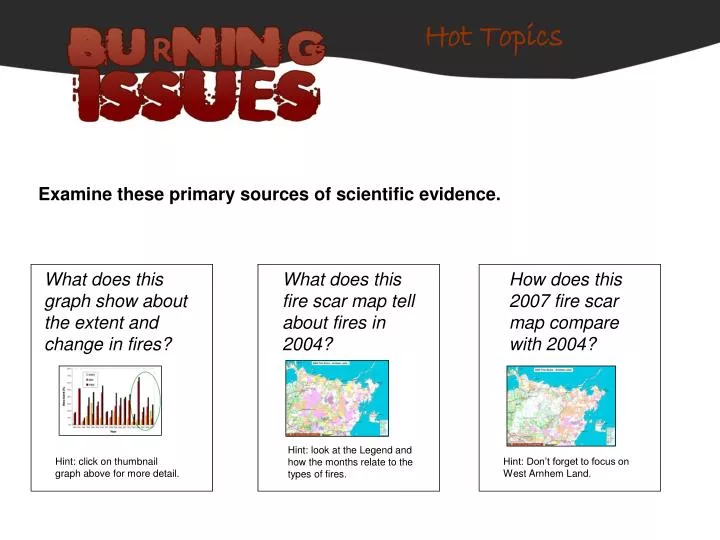
Hot Topics Examine these primary sources of scientific evidence. What does this graph show about the extent and change in fires? What does this fire scar map tell about fires in 2004? How does this 2007 fire scar map compare with 2004? Hint: look at the Legend and how the months relate to the types of fires. Hint: click on thumbnail graph above for more detail. Hint: Don’t forget to focus on West Arnhem Land.
Seasonal extent of 28,000 km2 WALFA region burnt 1990-2007. (The WALFA years are circled).
Figure 1 - 2004 Fire Scars (Arnhem Land) 2004 Fire Scars - Arnhem Land Green areas denote early dry season fires. Yellow, orange, pink and purple areas denote late dry season fires. (MODIS satellite imagery)
2007 Fire Scars - Arnhem Land Green areas denote early dry season fires. Yellow, orange, pink and purple areas denote late dry season fires. (MODIS satellite imagery)