Download

1 / 63
640 likes | 788 Views
t-Tests. Interval Estimation and the t Distribution. Large Sample z-Test. Sometimes we have reason to test hypotheses involving specific values for the mean. Example 1. Claim: On average, people sleep less than the often recommended eight hours per night.

E N D
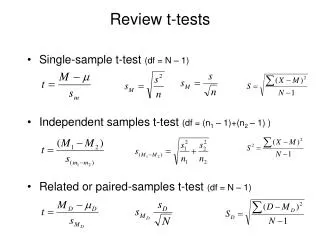
Large Sample z-Test • Sometimes we have reason to test hypotheses involving specific values for the mean. • Example 1. Claim: On average, people sleep less than the often recommended eight hours per night. • Example 2. Claim: On average, people drink more than the recommended 2 drinks per day. • Example 3. Claim: On average, women take more than 4 hours to run the marathon. • However, it is rare that we have a specific hypothesis about the standard deviation of the population under study. • For these situations, we can use the sample standard deviation s as an estimator for the population standard deviation s. • If the sample size is pretty big (e.g., >100), then this estimate is pretty good, and we can just use the standard z test. PSYC 6130, PROF. J. ELDER
Example: Canadian General Social Survey, Cycle 6 (1991) PSYC 6130, PROF. J. ELDER
But what if we don’t have such a large sample? PSYC 6130, PROF. J. ELDER
Student’s t Distribution • Problem: for small n, s is not a very accurate estimator of s. • The result is that the computed z-score will not follow a standard normal distribution. • Instead, the standardized score will follow what has become known as the Student’s t distribution. PSYC 6130, PROF. J. ELDER
Normal distribution t distribution, n=2, df=1 t distribution, n=10, df=9 t distribution, n=30, df=29 Student’s t Distribution How would you describe the difference between the normal and t distributions? PSYC 6130, PROF. J. ELDER
Student’s t distribution • Student’s t distribution is leptokurtic • More peaked • Fatter tails • What would happen if we were to ignore this difference, and use the standard normal table for small samples? PSYC 6130, PROF. J. ELDER
Student’s t Distribution • Critical t values decrease as df increases • As df infinity, critical t values critical z values • Using the standard normal table for small samples would result in an inflated rate of Type I errors. PSYC 6130, PROF. J. ELDER
One-Sample t Test: Example PSYC 6130, PROF. J. ELDER
Reporting Results • Respondents who report being very forgetful sleep, on average, 7.11 hours/night, significantly less than the recommended 8 hours/night, t(37)=2.25, p<.05, two-tailed. PSYC 6130, PROF. J. ELDER
Confidence Intervals • NHT allows us to test specific hypotheses about the mean. • e.g., is m < 8 hours? • Sometimes it is just as valuable, or more valuable, to know the range of plausible values. • This range of plausible values is called a confidence interval. PSYC 6130, PROF. J. ELDER
Confidence Interval Confidence Intervals • The confidence interval (CI) of the mean is the interval of values, centred on the sample mean, that contains the population mean with specified probability. • e.g., there is a 95% chance that the 95% confidence interval contains the population mean. • NB: This assumes a flat prior on the population mean (non-Bayesian). PSYC 6130, PROF. J. ELDER
95% Confidence Interval Confidence Intervals PSYC 6130, PROF. J. ELDER
Basic Procedure for Confidence Interval Estimation • Select the sample size (e.g., n = 38) • Select the level of confidence (e.g., 95%) • Select the sample and collect the data (Random sampling!) • Calculate the limits of the interval PSYC 6130, PROF. J. ELDER
End of Lecture 4 Oct 8, 2008
Selecting Sample Size • Suppose that • You have a rough estimate s of the standard deviation of the population, and • You want to do an experiment to estimate the mean within some 95% confidence interval of size W. PSYC 6130, PROF. J. ELDER
Assumptions Underlying Use of the t Distribution for NHT and Interval Estimation • Same as for z test: • Random sampling • Variable is normal • CLT: Deviations from normality ok as long as sample is large. • Dispersion of sampled population is the same as for the comparison population PSYC 6130, PROF. J. ELDER
Sampling Distribution of the Variance • We are sometimes interested in testing a hypothesis about the variance of a population. • e.g., is IQ more diverse in university students than in the general population? PSYC 6130, PROF. J. ELDER
p(s2) 0 s2 Sampling Distribution of the Variance • What form does the sampling distribution of the variance assume? • If the variable of interest (e.g., IQ) is normal, the sampling distribution of the variance takes the shape of a c-squared distribution: PSYC 6130, PROF. J. ELDER
n=9 n=29 n=99 p(c2) 0 50 100 150 c2 Sample Variances and the c-Square Distribution PSYC 6130, PROF. J. ELDER
Sample Variances and the c-Square Distribution • The c-square distribution is: • strictly positive. • positively skewed. • Since the sample variance is an unbiased estimator of the population variance: E(s2) = s 2 • Due to the positive skew, the mean of the distribution E(s2)is greater than the mode. • As the sample size increases, the distribution approaches a normal distribution. • If the original distribution is not normal and the sample size is not large, the sampling distribution of the variance may be far from c-square, and tests based on this assumption may be flawed. PSYC 6130, PROF. J. ELDER
Example: Height of Female Psychology Graduate Students 2005 PSYC 6130A Students (Female) Source: Canadian Community Health Survey Cycle 3.1 (2005) Caution: self report! PSYC 6130, PROF. J. ELDER
Properties of Estimators • We have now met two statistical estimators: PSYC 6130, PROF. J. ELDER
Conditions of Applicability • Comparing two samples (treated differently) • Don’t know means of either population • Don’t know variances of either population • Samples are independent of each other PSYC 6130, PROF. J. ELDER
Example: Height of Canadian Males by Income Category(Canadian Community Health Survey, 2004) PSYC 6130, PROF. J. ELDER
Sampling Distribution PSYC 6130, PROF. J. ELDER
Sampling Distribution (cntd…) PSYC 6130, PROF. J. ELDER
NHT for Two Large Samples PSYC 6130, PROF. J. ELDER
Height of Canadian Males by Income Category(Canadian Community Health Survey, 2004) PSYC 6130, PROF. J. ELDER
Example: Social Factors in Psychological Well-Being Canadian Community Health Survey, 2004 PSYC 6130, PROF. J. ELDER
Social Factors in Psychological Well-Being (cntd…) Canadian Community Health Survey, 2004 PSYC 6130, PROF. J. ELDER
Social Factors in Psychological Well-Being (cntd…) Canadian Community Health Survey, 2004: Respondents who report never getting along with others PSYC 6130, PROF. J. ELDER
NHT for Two Small Independent Samples PSYC 6130, PROF. J. ELDER
NHT for Two Small Independent Samples (cntd…) PSYC 6130, PROF. J. ELDER
Pooled Variance PSYC 6130, PROF. J. ELDER
Social Factors in Psychological Well-Being (cntd…) Canadian Community Health Survey, 2004: Respondents who report never getting along with others PSYC 6130, PROF. J. ELDER
Reporting the Result PSYC 6130, PROF. J. ELDER
95% Confidence Interval Confidence Intervals for the Difference Between Two Means PSYC 6130, PROF. J. ELDER
Underlying Assumptions • Dependent variable measured on interval or ratio scale. • Independent random sampling • (independence within and between samples) • In experimental work, often make do with random assignment. • Normal distributions • Moderate deviations ok due to CLT. • Homogeneity of Variance • Only critical when sample sizes are small and different. PSYC 6130, PROF. J. ELDER
End of Lecture 5 Oct 15, 2008
Social Factors in Psychological Well-Being (cntd…) Canadian Community Health Survey, 2004: Respondents who report never getting along with others PSYC 6130, PROF. J. ELDER
Separate Variances t Test • If • Population variances are different (suggested by substantially different sample variances) AND • Samples are small AND • Sample sizes are substantially different • Then • Pooled variance t statistic will not be correct. • In this case, use separate variances t test PSYC 6130, PROF. J. ELDER
Separate Variances t Test • This statistic is well-approximated by a t distribution. • Unfortunately, calculating the appropriate df is difficult. • SPSS will calculate the Welch-Satterthwaite approximation for df as part of a 2-sample t test: PSYC 6130, PROF. J. ELDER
Social Factors in Psychological Well-Being (cntd…) Canadian Community Health Survey, 2004: Respondents who report never getting along with others PSYC 6130, PROF. J. ELDER
Summary: t-Tests for 2 Independent Sample Means PSYC 6130, PROF. J. ELDER