Download
1 / 16
170 likes | 329 Views
AUTONOMOUS UNDERWATER VEHICLES IN THE GCOOS-RA FOOTPRINT. A HOOK FOR TEACHING HOW DATA ARE USED IN THE REAL WORLD C. Simoniello, C. Lembke , G.J. Kirkpatrick, R.H. Weisberg, B.A. Kirkpatrick, A.E. Jochens, M.K. Howard, S. Walker, C. Szczechowski , J. Cannizzaro, and D. English. Background.

E N D
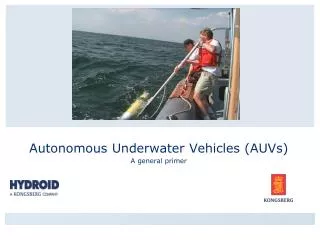
AUTONOMOUS UNDERWATER VEHICLES IN THE GCOOS-RA FOOTPRINT A HOOK FOR TEACHING HOW DATA ARE USED IN THE REAL WORLD C. Simoniello, C. Lembke, G.J. Kirkpatrick, R.H. Weisberg, B.A. Kirkpatrick, A.E. Jochens, M.K. Howard, S. Walker, C. Szczechowski, J. Cannizzaro, and D. English
Background • The health of the Gulf of Mexico is vital to the well-being of the nation • TX, LA, MS, AL and FL have a GDP of $2.2 Trillion* • Oil and Gas; Tourism; Ports (11 of top 15 tonnage ports in the U.S.**); Commercial Fisheries (4 of top 7 U.S. fishing ports by weight)*** • Students from Gulf Coast States Perform Poorly on STEM Assessments • 2011 U.S. H.S. Science and Engineering Readiness Index^: Texas, Alabama, Louisiana, and Mississippi ranked 31, 47, 48, and 50, respectively; Far below the national average. FL is the exception, ranking 11th. • The GCOOS-RA is working with its partners to address the deficiency in STEM skills required to: • Manage the living resources of the GOM; Make informed voting decisions; Power the future workforce; Compete in a global economy *2006 Bureau of Economic Analysis International Monetary Fund; **2004 USACOE Navigation Data Center; ***2010 NMFS; ^American Institute of Physics
Selecting Issues of Relevance to Students • Examples of the Scientific Process in progress that demonstrate the relevance of STEM disciplines to the everyday lives of GOM students: • Harmful Algal Bloom Research • DeepwaterHorizon Oil Spill Research • Complement current regional research priorities • GCOOS-RA, GOMA, Gulf Coast Ecosystem Restoration Task Force, and GOM Large Marine Ecosystem Projects
Why Integrate Data? Sensors on different platforms are used to monitor ocean conditions SPATIAL RESOLUTION TEMPORAL RESOLUTION • Fixed Platform • Typically information about • a limited area (low spatial • resolution) provided for a • prolonged period of time • (high temporal resolution) • Satellite Remote Sensing • Typically a ‘snapshot’ • (low temporal • resolution) of a large • area (high spatial resolution) Gliders/AUV Intermediate: provides large spatial coverage for extended periods of time.
Detecting Harmful Algal Blooms in the Gulf of Mexico • Cells with chlorophyll fluoresce (emit light). The light is emitted at certain wavelengths (~678 nm) or bands. • Irradiance sensors mounted on satellites measure the amount of radiance (light) leaving the sea surface. The sensors are set to measure light at 667 nm and 748 nm, wavelengths bracketing the fluorescent band of chlorophyll. • Fluorescence Line Height (FLH) is a relative measure of the amount of radiance leaving the sea surface in the chlorophyll fluorescence emission band. • Other compounds in seawater besides chlorophyll (e.g., suspended sediments, algae, protists), can also emit light. • Researchers must determine what part of the signal is due to chlorophyll in the water, and what is due to other materials.
Tampa Bay Sarasota Port Charlotte
10/05/2011 10/21/2011 Suspended sediment Windy conditions preceding 10/21/2011 led to high suspended sediment concentrations. FLH values for K. brevisblooms are overestimated during sediment resuspensionevents and are not reliable for identifying chlorophyll-rich waters. Go to the GCOOS data portal (http://gcoos.tamu.edu/products/) and locate a buoy in the vicinity of the bloom (try C14). Select ‘wind gusts’ and set begin/enddates about one week prior to 10/21. Plot the wind conditions on a graph. Internet or ‘canned’ data options.
Wind data are reported every 20 minutes (=72 data points/day). Students will have to think about how to graph: average all or a range of values; select one time for consistency.
USF COT glider Bass track 10/12 to 11/08/2011 (28 days, 38 km; max depth 39.1 m)
Way Points WP2 and WP 7 are at the same location, approximately two weeks apart. Using the temperature and salinity graphs, how might you explain the obvious difference In density from WP2 and WP 7?
Plot air temp to emphasize air-sea interactions . http://www.wunderground.com/history
The Deepwater Horizon Oil Spill April 20, 2010 DWH platform exploded 50 mi. SE of the MS Delta and sank ~ 5,000 ft. beneath sea surface. Oil flowed freely until July 15, 2010 How much crude oil is flowing? Not really sure. ROV Image Ignites Flow Rate Debate 225 controlled burns remove >11.1 M gal 1.85 M gal dispersants (surface and subsea) 34.7 M gal oily water recovered NOTE: Reported by NOAA and USGS…not peer-reviewed literature 4.9 M barrels ~ 205 M gal …where is the rest?
Where Will the Oil Go?: Integrating Data Sets to Predict Circulation Patterns Model outputs for 1 June 2010. Models all predict oil near the WFS. Liu et al., 2011 Where is the Loop Current? Temperature comparison 6/2010: Model limitations under-predict upwelling & emphasize need for data. English et al., 2012 Satellites: MODIS Aqua-1 true color Oil Spill at DWH oil rig. Estimates of oil from satellites did not mesh with flow estimates. LSU ESL WFS ROMS Glider
SHIP: USF locations of bio-optical profiles May-August 2010. GLIDER (top right): Bio-optical sensors on AUVs show a distinct backscatter anomaly near a DWH oil patch. Ship-based CTD casts (right): Transmissometer and chlfluorometer and 6-channel backscattering meter (interpolated to 660 nm) from two stations near the DWH site. Three casts at station NTO7 (blue, magenta, red dots); one at NT08 (green dots). Data from D. English et al., 2012
Beach Sediment as an Example of Resolution SPATIAL RESOLUTION Frame challenging topics using familiar examples and analogies.