Download
1 / 30
500 likes | 1.55k Views
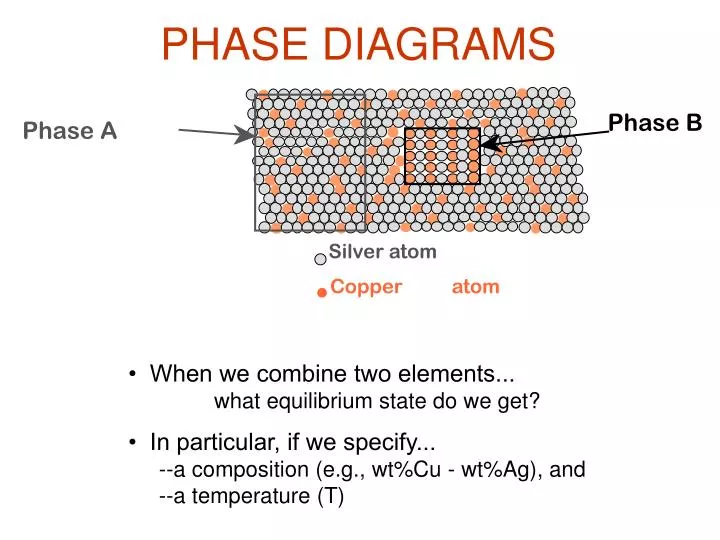
PHASE DIAGRAMS. Phase B. Phase A. Silver atom. Copper. atom. • When we combine two elements... what equilibrium state do we get?. • In particular, if we specify... --a composition (e.g., wt%Cu - wt%Ag), and --a temperature (T). THE SOLUBILITY LIMIT.

E N D
PHASE DIAGRAMS Phase B Phase A Silver atom Copper atom • When we combine two elements... what equilibrium state do we get? • In particular, if we specify... --a composition (e.g., wt%Cu - wt%Ag), and --a temperature (T)
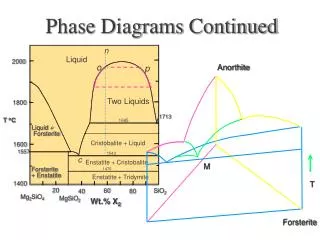
THE SOLUBILITY LIMIT • Solubility Limit: Max concentration for which only a solution occurs. (No precipitate) • Ex: Phase Diagram: Water-Sugar System Question: What is the solubility limit at 20C? Answer: 65wt% sugar. If Comp < 65wt% sugar: syrup If Comp > 65wt% sugar: syrup + sugar coexist • Solubility limit increases with T: e.g., if T = 100C, solubility limit = 80wt% sugar.
B C EFFECT OF T & COMPOSITION (Co) A • Each point on this phase diagram represents equilibrium • Changing T can change # of phases: path A to B • Changing Co can change # of phases: path B to C
WATER-SALT PHASE DIAGRAM Solubility limit Reduction in freezing point
COMPONENTS AND PHASES • Components: The elements or compounds which are mixed initially (e.g., Al and Cu, or water and sugar) • Phases: The physically and chemically distinct material regions that result (e.g., α and β, or syrup and sugar) Aluminum- Copper Alloy Adapted from Fig. 9.0, Callister 3e.
PHASE DIAGRAMS • Tell us about phases as function of T, Co, P • For this course: --binary systems: just 2 components. --independent variables: T and Co (P = 1 atm is always used) • Phase Diagram for Cu-Ni system • Isomorphous system: i.e., complete solubility of one component in another Adapted from Fig. 9.2(a), Callister 6e. (Fig. 9.2(a) is adapted from Phase Diagrams of Binary Nickel Alloys, P. Nash (Ed.), ASM International, Materials Park, OH (1991). Note change in melting point
PHASE DIAGRAMS:# and types of phases • Rule 1: If we know T and Co, then we know: --the # and types of phases present. • Examples: A: 1 phase (α) B: 2 phases (L + α) Cu-Ni phase diagram
PHASE DIAGRAMS: composition of phases • Rule 2: If we know T and Co, then we know: --the composition of each phase. Cu-Ni system • C0 = 35 wt% Ni • At 1300 C: • Only liquid (L) • CL = C0 (= 35 wt% Ni) • At 1150 C: • Only solid (α) • Cα = C0 (= 35 wt% Ni) • At TB: • Both α and L • CL = Cliquidus (= 32 wt% Ni) • Cα = Csolidus (=43 wt% Ni) Examples:
PHASE DIAGRAMS: weight fractions of phases • Rule 3: If we know T and Co, then we know: --the amount of each phase (given in wt%). Cu-Ni system • C0 = 35 wt% Ni • At 1300 C: • Only liquid (L) • WL = 100 wt%, Wα = 0 wt% • At 1150 C: • Only solid (α) • WL = 0 wt%, Wα = 100 wt% • At TB: • Both α and L • WL = S/(R+S) = • (43-35)/(43-32) = 73 wt% • Wα = R/(R+S) = • (35-32)/(43-32) = 27 wt% The lever rule 10
THE LEVER RULE: A PROOF • Sum of weight fractions: • Conservation of mass (Ni): • Combine above equations: • A geometric interpretation:
COOLING A Cu-Ni BINARY • System is: --binary i.e., 2 components: Cu and Ni. --isomorphous i.e., complete solubility of one component in another; α phase field extends from 0 to 100wt% Ni. • Consider Co = 35wt%Ni. • Equilibrium cooling 12
NON-EQUILIBRIUM PHASES • Cα changes as we solidify. • Cu-Ni case: First α to solidify has Cα = 46wt%Ni. Last α to solidify has Cα = 35wt%Ni. • Fast rate of cooling: Cored structure • Slow rate of cooling: Equilibrium structure
MECHANICAL PROPERTIES:Cu-Ni System • Effect of solid solution strengthening on: --Tensile strength (TS) --Ductility (%EL,%AR) Adapted from Fig. 9.5(a), Callister 6e. Adapted from Fig. 9.5(b), Callister 6e.
Ex.: Cu-Ag system BINARY-EUTECTIC SYSTEMS • 3 single phase regions α, β (L, ) • Limited solubility: α : FCC, mostly Cu β : FCC, mostly Ag • T : No liquid below T E E • C : Min. melting T E composition has a special composition with a min. melting T. 2 components Cu-Ag system • 3 two phase regions • Cooling along dotted line: L (71.9%) α (8%) + β (91.2%) Adapted from Fig. 9.6, Callister 6e. (Fig. 9.6 adapted from Binary Phase Diagrams, 2nd ed., Vol. 1, T.B. Massalski (Editor-in-Chief), ASM International, Materials Park, OH, 1990.)
EX: Pb-Sn EUTECTIC SYSTEM (1) • For a 40wt%Sn-60wt%Pb alloy at 150C, find... --the phases present --the compositions of the phases --the relative amounts of each phase Pb-Sn system Adapted from Fig. 9.7, Callister 6e. (Fig. 9.7 adapted from Binary Phase Diagrams, 2nd ed., Vol. 3, T.B. Massalski (Editor-in-Chief), ASM International, Materials Park, OH, 1990.)
EX: Pb-Sn EUTECTIC SYSTEM (2) • For a 40wt%Sn-60wt%Pb alloy at 150C, find... --the phases present: α + β --the compositions of the phases: Cα = 11wt%Sn Cβ = 99wt%Sn --the relative amounts of each phase: (lever rule) Pb-Sn system Adapted from Fig. 9.7, Callister 6e. (Fig. 9.7 adapted from Binary Phase Diagrams, 2nd ed., Vol. 3, T.B. Massalski (Editor-in-Chief), ASM International, Materials Park, OH, 1990.)
MICROSTRUCTURESIN EUTECTIC SYSTEMS-I • Co < 2wt%Sn • Result: --polycrystal of α grains. Adapted from Fig. 9.9, Callister 6e.
MICROSTRUCTURESIN EUTECTIC SYSTEMS-II • 2wt%Sn < Co < 18.3wt%Sn • Result: --α polycrystal with fine β crystals. Pb-Sn system Adapted from Fig. 9.10, Callister 6e.
MICROSTRUCTURESIN EUTECTIC SYSTEMS-III • Co = CE (Eutectic composition) • Result: Eutectic microstructure --alternating layers of α and β crystals. Pb-Sn system Adapted from Fig. 9.12, Callister 6e. (Fig. 9.12 from Metals Handbook, Vol. 9, 9th ed., Metallography and Microstructures, American Society for Metals, Materials Park, OH, 1985.) Adapted from Fig. 9.11, Callister 6e.
MICROSTRUCTURESIN EUTECTIC SYSTEMS-IV • 18.3wt%Sn < Co < 61.9wt%Sn • Result:α crystals and a eutectic microstructure Pb-Sn system Adapted from Fig. 9.14, Callister 6e.
HYPOEUTECTIC & HYPEREUTECTIC Adapted from Fig. 9.7, Callister 6e. (Fig. 9.7 adapted from Binary Phase Diagrams, 2nd ed., Vol. 3, T.B. Massalski (Editor-in-Chief), ASM International, Materials Park, OH, 1990.) (Figs. 9.12 and 9.15 from Metals Handbook, 9th ed., Vol. 9, Metallography and Microstructures, American Society for Metals, Materials Park, OH, 1985.) Adapted from Fig. 9.15, Callister 6e. Adapted from Fig. 9.15, Callister 6e. (Illustration only) Adapted from Fig. 9.12, Callister 6e.
IRON-CARBON (Fe-C) PHASE DIAGRAM • Pure iron: 3 solid phases • BCC ferrite (α) • FCC Austenite (γ) • BCC δ • Beyond 6.7% C cementite (Fe3C) • Eutectic: 4.3% C • L γ + Fe3C • (L solid + solid) • Eutectoid: 0.76% C • γα + Fe3C • (solid solid + solid)
Fe-C PHASE DIAGRAM: EUTECTOID POINT Pearlite microstructure: Just below the eutectoid point
EUTECTOID POINT: LEVER RULE • Just below the eutectoid point: • Wα = (6.7-0.76)/(6.7-0.022) = 89% • WFe3C = (0.76-0.022)/(6.7-0.022) = 11%
HYPOEUTECTOID STEEL Proeutectoid α: α phase formed at T > Teutectoid
ALLOYING STEEL WITH MORE ELEMENTS • Teutectoid changes: • Ceutectoid changes: Adapted from Fig. 9.31,Callister 6e. (Fig. 9.31 from Edgar C. Bain, Functions of the Alloying Elements in Steel, American Society for Metals, 1939, p. 127.) Adapted from Fig. 9.32,Callister 6e. (Fig. 9.32 from Edgar C. Bain, Functions of the Alloying Elements in Steel, American Society for Metals, 1939, p. 127.)
SUMMARY • Phase diagrams are useful tools to determine: --the number and types of phases, --the wt% of each phase, --and the composition of each phase for a given T and composition of the system. • Alloying to produce a solid solution usually --increases the tensile strength (TS) --decreases the ductility. • Binary eutectics and binary eutectoids allow for a range of microstructures.