Download
1 / 16
160 likes | 184 Views
This study examines racial/ethnic disparities in cancer across the continuum, including screening, stage at diagnosis, therapy, and survival. It analyzes age-adjusted incidence rates, mortality rates, and treatment data for different racial/ethnic groups.

E N D
Racial/Ethnic Disparities in Cancer Incidence, Survival and Treatment Linda C. Harlan, PhD, MPH National Cancer Institute Division of Cancer Control and Population Sciences
Disparities in Cancer • Age • Gender • Marital Status • Income • Education • Insurance • Health System Characteristics • Geographic • Race/Ethnicity
Age-Adjusted US Mortality Rates for the Most Common Cancers by Race/Ethnicity for 2000-2003 Source: US population NCHS
Racial/Ethnic Disparities Along the Cancer Continuum • Incidence • Screening • Stage at Diagnosis • Therapy • Survival
Age-Adjusted Incidence Rates for the Most Common Cancers by Race/Ethnicity for 2000-2003 Source: SEER
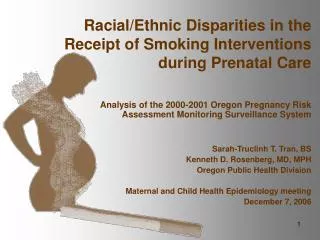
Percentage of Women Age 40 and Older Reporting Having Mammography in the Past Two Years Source: NCHS
Documented Time Elapsed Since Last Mammogram for Women Age 40 and Older by Racial/Ethnic Group* *Adjusted for age and registry Source: Smith-Bindman, 2006
SEER Data • Population-Based Registries • Register all cancer cases within a geographic areas • 26% of the US population • Detailed data on • Demographics • Tumor characteristic • Treatment • Active follow-up of cases • Public use files, available to researchers • Analysis program associated with data
Stage at Diagnosis of In Situ and Invasive Breast Cancer by Race/Ethnicity for Cases Diagnosed in 2000-2003 Source: SEER
5-year Cancer-Specific Survival by Race/Ethnicity and Stage for Invasive Breast Cancer Patients Diagnosed Between 1990 -2002 Source: SEER
Percentage of Women Receiving Radiation Following Breast Conserving Surgery by Racial/Ethnicity and Year of Diagnosis Tumor < 5cm Source: SEER
Percent of Breast Cancer Cases Receiving Radiation Following BCS by Race/Ethnicity and County Family Poverty Rate 2000-2003 Source: SEER Families at or Below Poverty Level
Use of Adjuvant Chemo/Hormonal Therapy for Early Stage, Node Negative Breast Cancer by Race/Ethnicity, and ER status 2000 Source: Harlan unpublished ER negative ER positive
Adjusted* Percentage of Patients Diagnosed 1995 through 1999 Receiving Guideline Therapy by Insurance Status and Race/Ethnicity *Charlson score, stage, number of positive lymph nodes, residency training program, hospital bed size, age, marital status, % high school diploma, gender, geographic region Source: Harlan, 2005
Summary • Racial/ethnic disparities occur across the cancer continuum • Screening • Stage at diagnosis • Treatment • Survival
Data Sources • Surveillance, Epidemiology and End-Results Data • http://seer.cancer.gov/seerstat/ • Demographic, tumor characteristic, surgery and radiation • Active follow-up for vital status • SEER-Medicare linked file • http://healthservices.cancer.gov/seermedicare/obtain/ • Cancer cases age 65+ and a 5% sample of non-cancer patients • SEER data + • Treatment data, long-term medical follow-up, procedures • Breast Cancer Surveillance Consortium • Mammography registries • http://breastscreening.cancer.gov/work/proposal_data.html