Download
1 / 28
280 likes | 445 Views
Inferences About Means of Single Samples. Chapter 10 Homework: 1-6. Evaluating Hypotheses About Means. Evaluating hypothesis about population simplest research situation taking a single sample Test statistics z test if s known t test if s unknown If reject H 0

E N D
Inferences About Means of Single Samples Chapter 10 Homework: 1-6
Evaluating Hypotheses About Means • Evaluating hypothesis about population • simplest research situation • taking a single sample • Test statistics • z test if s known • t test if s unknown • If reject H0 • evaluate practical significance ~
Steps in Hypothesis Evaluation 1. State null & alternative hypotheses 2. Set criterion for rejecting H0 3. collect sample; compute sample statistic & test statistic 4. Interpret results • Steps 1 & 2 before collecting data ~
1. State null & alternative hypotheses • s unknown • calculate X,s, & s X from sample • use t test • Average college students study 21 hours per week? • Do Coe students study 21 hrs/week? • Nondirectional hypothesis: n = 16 • H0 : m = 21; H1 : m¹21 • reject H0 if increase or decrease ~
1. State null & alternative hypotheses • 3 important distributions • variable: X • sample statistic: X • central limit theorem • test statistic: z or t • known probabilities • Distributions show all possible values of variable • assuming H0 is true
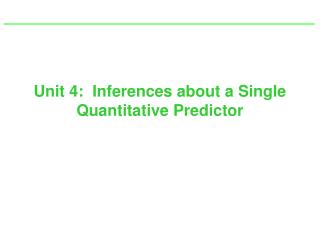
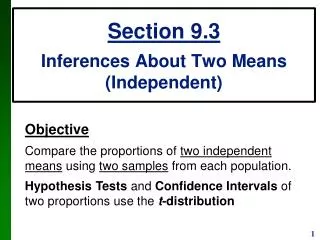
What does distribution of sample statistic look like if Ho true? If Ho is false? +1 -2 -1 +2 0
1. State null & alternative hypotheses • Test statistic • General form • test statistic = sample statistic - population parameter • standard error of sample statistic
2. Set Criterion for Rejecting H0 • Directionality & level of significance • Xobs = computed sample statistic • same as randomly drawing a single X from sampling distribution of means • X CV = critical value of the statistic • set in advance • beginning of the rejection region • area in tails of distribution • if Xobs lies beyond, reject H0 ~
2. Set Criterion for Rejecting H0 • Computing critical values of statistic • X CV = m+tCV(sX) • same as confidence intervals • X CV = upper & lower limits • reject H0 if beyond • *Critical value of test statistic • df = 15 • t.05 = 2.131 (nondirectional) ~
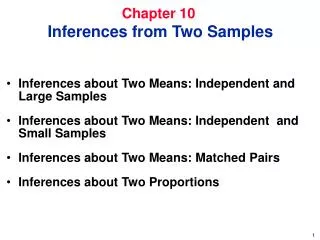
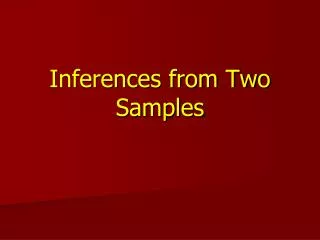
2. Set Criterion for Rejecting H0 • Rejection region • portion of distribution beyond critical value • area in tails • for sample statistic or test statistic • Level of significance • if a = .05 • nondirectional: .025 in each tail • .025 + .025 = .05 ~
-2 -1 0 1 2 -2.131 +2.131 Rejection regions f
2. Set Criterion for Rejecting H0 • Test statistic • observed value • computed from sample • critical value • criterion set in advance • depends on a (level of significance) • & directionality • nondirectional: t.05 = 1.96 • if directional: t.05 = 1.645 ~
2. Set Criterion for Rejecting H0 • Decision • if tobsis beyond tCV,then reject H0 • if not, “accept” H0
3. Collect sample & compute statistics • Collect data & compute test statistic • X = 24.63; s = 7.78, s X = 1.94 • Test statistic
4. Interpret Results • Is tobsis beyond tCV? • NO. 1.87 < 2.131 • then “accept” H0 • Students study about 21 hrs per week. • No significant difference • does not mean they are equal • not sufficient data to reject • Practical significance not an issue ~
A Directional Hypothesis • s unknown: same question • evidence from prior surveys that Coe students study more than 21 hrs per week • experimental hypothesis = H1 • can use directional hypotheses ~
A Directional Hypothesis 1. State H0 & H1 • H0: m< 21 • Coe students study less than or equal to 21 hrs per week • H1: m > 21 • Coe students study more than 21 hrs per week ~
A Directional Hypothesis 2. Set criterion for rejecting H0 • a = .05, level of significance • directional (one-tailed) test • df = 15 • tCV = 1.753 • critical value for area = .05 (one-tailed) ~
A Directional Hypothesis 3. Collect sample & compute statistics • X = 24.63; s = 7.78, s X = 1.94 • test statistic = tobs
A Directional Hypothesis 3. Interpret results • tobs > tCV 1.87 > 1.753 • Reject H0 • accept H1 Coe students study more than 21 hours per week ~
Practical Significance • Statistical significance? • YES • Practical significance? • MAYBE • Determining practical significance • effect size ~
Practical Significance: Effect size • Magnitude of the result (difference) • Raw effect size • measured on scale of original data • Xobs- m = 24.63 - 21 = 3.63 • Coe students study 3.63 hours per week longer than the national average ~
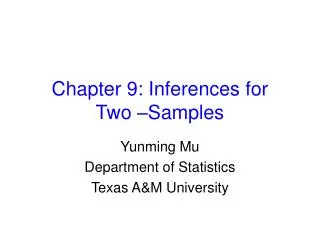
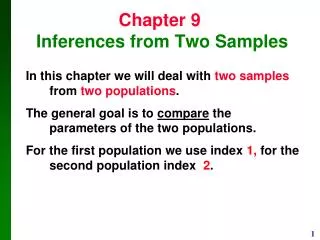
Practical Significance: Effect size • Effect size index • compare effect size for variables using different scales (e.g. GRE, ACT) • divide difference by s • nondirectional directional
d = .47 standard deviations above the mean +1 -2 -1 +2 0
Practical Significance: Effect size • Is effect magnitude practically significant? • .5 considered moderate effect size • e.g., Is it worth using a new statistics textbook that test scores d = .5? • Ultimately we must make decision • using our expertise • considering many factors ~
When s Is Known • Usually not the situation • calculate X from sample • use z test • degrees of freedom not relevant • find zCV in z table • use s X
Practical Significance: Effect size • Effect size index: s is known • nondirectional directional
Relationship to Confidence Intervals • Nondirectional tests equivalent to CI • Level of significance: a = .05 • Level of confidence: 1- a = .95 • 95% confident that true value of m falls within interval • if it does: H0 is true • If falls outside CI: reject H 0 ~