Download
1 / 12
120 likes | 136 Views
Explore how CPU and memory percentages are calculated in applications to determine resource consumption and grading metrics. Learn how to avoid validity threats in assessing application performance.

E N D
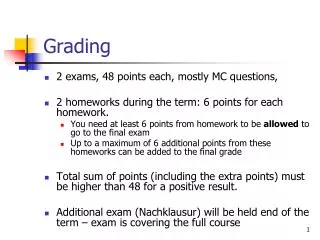
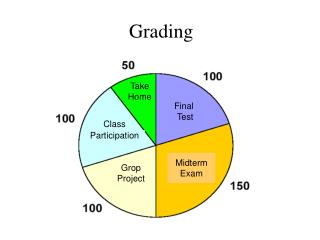
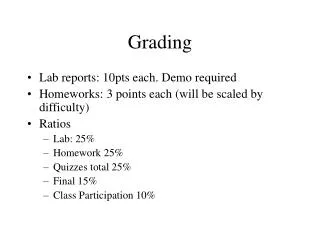
Application Grading Metrics
Outline • What information can we get? • TOP • CPU • Memory • Our calculation • Threats to validity
TOP • We analyzed TOP's source code • CPU percentage calculation • Memory calculation
CPU Percent • Process “ticks” = utime + stime(both from /proc/[pid]/stat) • Total “ticks” = utime + ntime + stime + itime + iowtime + irqtime + sirqtime(all from /proc/stat) • CPU Percent = (process ticks) / (total ticks)
Memory • rss field in /proc/[pid]/proc • rss = Resident Set Size • Gives number of pages process has in real memory
Outline • What information can we get? • Our calculation • Peak? • Resource consumption * time • Resource expenditure / service provided • Our current metric • Threats to validity
Peak? No! Inaccurate: program using memory on right is obviously worse.
Consumption * Time Much better: calculate area under curves. Much like KW-Hours.
Divide by service provided • When grading, we can't do a simplistic calculation like TOP does • Applications used more often shouldn't be graded more poorly • Divide consumption by amount of service provided • Measure service provided in seconds of foreground time (obtained via ActivityManager)
Our current metric • If an application always runs in the background, it shouldn't have an infinitely bad grade, so give BG time some weight. • CPU: • CPU-Mins/(0.9*FG-Mins + 0.1*BG-Mins) • Memory • MB-Mins/(0.9*FG-Mins + 0.1*BG-Mins)
Outline • What information can we get? • Our calculation • Threats to validity • CPU variance • Memory approximation
Threats to validity • Not all CPU-minutes are created equal! • Memory consumption is coarsely approximated using Riemann sums