Download
1 / 25
260 likes | 347 Views
Few industries are as metrics driven as telco and fewer still are as data rich. Everything in the telco world creates data: voice, video, customer calls, SIM cards, cell towers, network switches, even the trucks they drive produce telematics. The challenge is that the growth of data rich services coupled with industry consolidation has created working sets that have overwhelmed the capacity of these organizations to evaluate their datasets in full - so they downsample, index and aggregate to avoid paying millions to scale out CPU solutions that were not designed for these types of tasks. Enter the GPU and GPU-powered analytics. These massively parallel solutions turn minutes into milliseconds and provide full view of the operational landscape - not slivers.

E N D
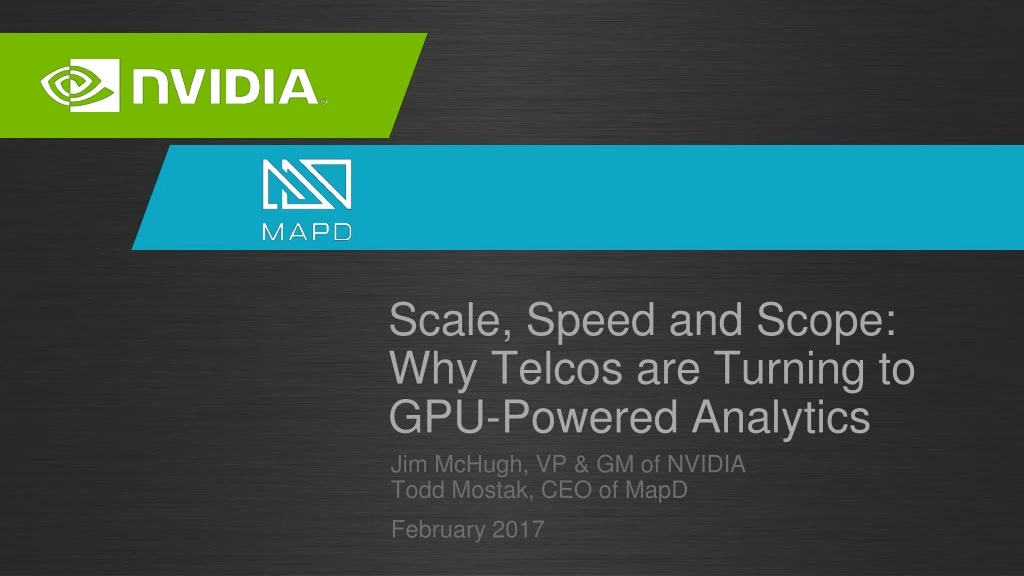
Scale, Speed and Scope: Why Telcos are Turning to GPU-Powered Analytics Jim McHugh, VP & GM of NVIDIA Todd Mostak, CEO of MapD February 2017
The rapidly evolving telco business model and its implications Why current compute models are struggling The path forward: GPUs and GPU-powered analytics AGENDA How to enable speed at scale Case Studies: How GPUs go to market in the service provider world 2 2
The Shifting Landscape for Service Providers CONTINUED CONSOLIDATION NETWORK CONVERGENCE GROWTH OF BUSINESS SERVICES DATA EXPLOSION, NOT REVENUE 3
Not Just Data Volume, Data Types Customer: Satisfaction: network, call, service Network: speed, latency, signal strength, network type Age, family size, gender, brand preference, behavior Usage: Location: Hardware: data, browser, type, time spent, text GPS, wifi estimation, accelerometer Handset, chipset, RAM, screen size, SIM card, software version 4
Driving Complex, Value-Laden Use Cases Rationalize and prioritize infrastructure investment Customer Experience Management (Customer 360) Operational Analytics Network Optimization Data monetization 5
Slow Compute – The Bottleneck Long response time constrains questions asked. Over time this behavior hardens.1 Issuing iterative queries becomes wearisome. Analyst creativity is impaired. As little as 500ms reduces interaction and limits the amount of data covered.2 For large scale data problems, potential avenues of exploration are ignored because the time cost is too high to even consider.3 1. http://engineroom.ft.com/2016/04/04/a-faster-ft-cåom/ 2. http://go.mapd.com/rs/116-GLR-105/images/2014-Latency-InfoVis.pdf 3. https://www.microsoft.com/en-us/research/publication/trust-me-im-partially-right-incremental-visualization-lets-analysts-explore-large-datasets-faster/ 6
Workarounds Create Additional Problems $ Sampling misses the whole picture Pre-aggregation struggles at scale Scale out on CPU infrastructure has tremendous hidden costs EXPLORE THE OUTLIERS AND LONG-TAIL EVENTS RELY ON ACCURATE DATA SCALE WITH A ROI 7
The GPU Accelerated Data Center NVIDIA GPU x86 CPU 6.0 5.0 P100 4.0 TFLOPS K80 3.0 Fast GPU + Strong CPU 2.0 K40 K20 M2090 1.0 M1060 0.0 2008 2009 2010 2011 2012 2013 2014 2016 8
GPU Accelerated Analytics Accelerated analytics, everywhere, every platform DGX-1 TESLA Servers in every shape and size CLOUD Everywhere The accelerated analytics supercomputer for instant productivity 9
NVIDIA DGX-1 Accelerated analytics supercomputer-in-a-box 170 TFLOPS | 8x Tesla P100 16GB | NVLink Hybrid Cube Mesh 2x Xeon | 8 TB RAID 0 | Quad IB 100Gbps, Dual 10GbE | 3U — 3200W 10
NVIDIA and MapD for Accelerated Analytics IMMERSIVE VISUALIZATION UNPARALLELED SPEED PETABYTE SCALE Explore and discover insights in milliseconds with world’s fastest data exploration platform Instantaneously visualize and query multi-billion row datasets across multiple high density nodes Dynamically interact and visualize billions of data points in milliseconds 11
MapD: software optimized for the fastest hardware SPEED OF THOUGHT VISUALIZATION 100X FASTER QUERIES + MapD Core MapD Immerse An in-memory, relational, column store database powered by GPUs A visual analytics engine that leverages the speed + rendering capabilities of MapD Core 12
Proof Points Noted DB blogger, Mark Litwintschik has benchmarked MapD vs. major CPU systems and found it to be between 74x to 3,500x faster than CPU-powered databases. 13
Performance Starts with Memory Management Hot Data Speedup = 1500x to 5000x Over Cold Data GPU RAM (L1) 24GB to 384GB 3000-5000 GB/sec COMPUTE LAYER SPEED INCREASES SIZE INCREASES Warm Data Speedup = 35x to 120x Over Cold Data CPU RAM (L2) 32GB to 3TB 70-120 GB/sec SSD or NVRAM STORAGE (L3) 250GB to 20TB 1-2 GB/sec Cold Data STORAGE LAYER Data Lake/Data Warehouse/SOR 14
Purpose Built + Highly Optimized Query Compilation Engine creates one custom function that runs at speeds approaching hand-written functions. LLVM enables generic targeting of different architectures + run simultaneously on CPU/GPU. 15
Purpose Built + Highly Optimized Backend Rendering — Data goes from compute (CUDA) to graphics (OpenGL) pipeline without copy and comes back as compressed PNG (~100 KB) rather than raw data (> 1GB). 16
Purpose Built + Highly Optimized Streaming — Speed eliminates need to pre-index or aggregate data. Compute resides on GPUs freeing CPUs to parse + ingest. Finally, newest data can be combined with billions of rows of “near historical” data. 17
Verizon CHALLENGE SOLUTION IMPACT Using MapD’s GPU-powered database + visual analytics engine, Verizon was able to execute queries against the entire SIM card population. The down sampling required by CPU-era solutions was missing key outliers. Over the air (OTA) technology is the primary way wireless companies manage subscribers (via SIM cards). OTA polling + pushes create massive data files. Finding those outliers was worth millions. Further, Verizon was able to query + visualize streaming data + near historical data – for the entire country or an individual card. Additionally, ease of use drove higher utilization thus more informed decision-making. Verizon’s legacy CPU powered database did not allow real- time queries – so they down sampled to reduce time…. but they sensed they were not getting the whole picture. All at a fraction of the cost. 19
Major US Cable Operator CHALLENGE SOLUTION IMPACT Using GPU-powered visual analytics from MapD and NVIDIA the operator was able to see their entire footprint – eliminating the need to go section by section. The solution has completely altered the company’s approach for business services, resulting in operational efficiencies (discovered some contractors “inspecting” the same property 10+ times), targeting marketing more effectively (based on capacity utilization based marketing) and campaign analytics. The business services team was stuck with hardware and software that only enabled them to look at 1x1 mile blocks. Each new block required long wait times — taking minutes to load. Furthermore, they retained full grain level detail on every customer for when they zoomed into a building or residence. As a result, there was no adjacent discovery and they struggled to optimize marketing around capabilities and infrastructure. 20
Major Wireless Provider CHALLENGE SOLUTION IMPACT Using NVIDIA GPUs and MapD the telco was able to see and interact with their national footprint – not a neighborhood. Using less HW the telco was able to determine, instantaneously, what infrastructure projects would yield the best ROI from a coverage map perspective – while improving customer experience and reducing dropped calls. Client subscribed to third party performance data to prioritize what to upgrade to create better coverage map claims. Their current CPU-era infrastructure only allowed them to see 3% of the data in any given region. Zoom, cross-filter etc. all work in real time. 21
For More Information / Twitter: @MapD, @ToddMostak / Product Overview: www.mapd.com/products / Demos: www.mapd.com/demos / Twitter: @NVIDIADC, @JimMcHugh / DGX for Accelerated Analytics: www.nvidia.com/analytics / DGX for Deep Learning: www.nvidia.com/dgx1 23
May 8 - 11, 2017 | Silicon Valley | #GTC17 www.gputechconf.com CONNECT Connect with technology experts from NVIDIA and other leading organizations LEARN Gain insight and valuable hands-on training through hundreds of sessions and research posters DISCOVER See how GPUs are creating amazing breakthroughs in important fields such as deep learning and AI INNOVATE Hear about disruptive innovations from startups SAVE ADDITIONAL 20% OFF REGULAR RATES AT WWW.GPUTECHCONF.COM Don’t miss the world’s most important event for GPU developers May 8 – 11, 2017 in Silicon Valley: MapD in booth #621 24