Download
1 / 9
90 likes | 196 Views
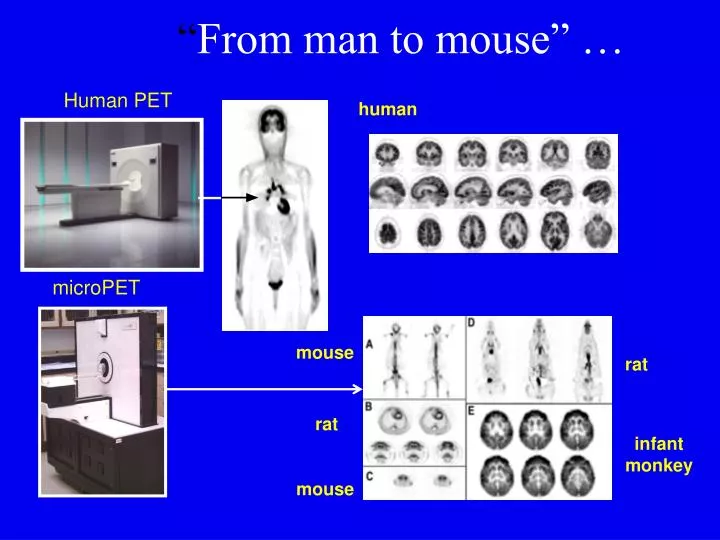
“ From man to mouse” …. Human PET. human. microPET. mouse. rat. rat. infant monkey. mouse. .. and back again. A. F. Structure. M. A. 0.1 mm. Topography. Doppler. µm to mm. ~10 3 cells quantitative. Tissue Density, Z. A. 20-50 µm. M. F. Radiotracer. A. F. M.

E N D
“From man to mouse” … Human PET human microPET mouse rat rat infant monkey mouse
A F Structure M A 0.1 mm Topography Doppler µm to mm ~103 cells quantitative Tissue Density, Z A 20-50 µm M F Radiotracer A F M ~1-2 mm H Concentration <10-12 mole = quantitative 0.1 mm BOLD, DCE -galactocidase 0.1 µmole H / µmole 31P Molecular(?) Imaging Modalities Optical (Bioluminescence, fluorescence) Ultrasound CT PET/SPECT MRI
Coded Aperture Parallel Holes Pinhole b a b a b a t d • Better Resolution • High Efficiency • Complicated Reconstruction • Better Resolution • Little Field of View • Low Efficiency L Mechanic Collimation • Resolution & Efficiency inversely related
Cardiac SPECT Images Normal Myocardial Perfusion at stress and rest Single Vessel Coronary Artery Disease at stress and rest SPECT image shows limited perfusion (horseshoe shape rather than donut) especially under stress. SPECT image exhibits full perfusion (bright, donut shape) both at rest and under stress
Performances not good enoughfor imaging biological process in vivo in small animals (mice) man rat Trying to Image apoptosis by proper tracer (e.g.99mTcINIC-Annexin-V) Geant 4 simulation detector area: 100 x 100 mm2 aorta: ~ 2 mm diameter plaque size: 0.5 x 1 x 4 mm3 • - pixellated CsI(Tl) (0.8 - 0.4 mm pitch) • LaBr3 continuous (3 mm thick, different surface(s) treatment(diffusive vs absorptive) • 6 x 6 mm2, 3 x 3 mm2, 1.5 x 1.5 mm2 • (PMT anode pixel size) spatial resolution: ~ 500 m system sensitivity: ~ 10 cps/Ci 1000 counts/view/resol.elem. 1 plaque = 10 mCi,10 resol.elem.
Preliminary pinhole SPECT reconstruction results from the CsI detector Images are displayed as MIP (maximum-intensity-re-projections) animations 2 point sources APOE mouse (kidneys shown) Flood image Sample projection image Fig. 28 APOE mice
Caratteristiche insufficientiper l’imaging di processi biologici in piccoli animali (topi). E’ necessario migliorare la risoluzione spazialee l’efficienza • Small size detectors (high pixellization) • Individual detectors or “perfect” coding Human Rat Required spatial resolution: 6 mm FWHM (200 mm3) 1 mm FWHM ( 1 mm3) 2 mm FWHM (8 mm3)