Download
1 / 33
330 likes | 452 Views
Technologies for Energy Production and Utilization in a Carbon Constrained World. Rodney Andrews, PhD PE Director Center for Applied Energy Research University of Kentucky. World Energy Use Growing Dramatically with Population. 12. 1400. 1200. 10. World Population. 1000. 8. 800.

E N D
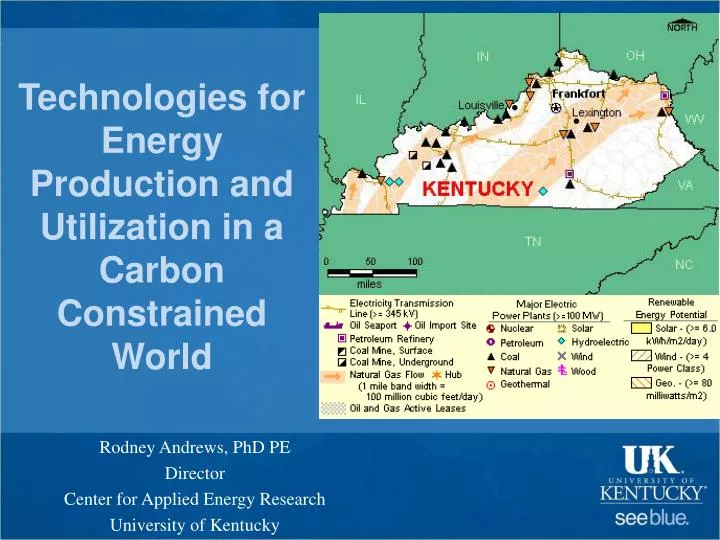
Technologies for Energy Production and Utilization in a Carbon Constrained World Rodney Andrews, PhD PE Director Center for Applied Energy Research University of Kentucky
World Energy UseGrowing Dramatically with Population 12 1400 1200 10 World Population 1000 8 800 Energy Consumption (Qbtu / yr) 6 600 World Energy Consumption Population (Billions) 4 400 Population of Developed Countries 2 200 0 0 1900 1950 2000 2050 2100 Year Source: USDOE
Universal Need for Affordable Energy Affluence Japan France U.S. UK Mexico South Korea GDP per Capita ($ / yr / person) Poland China Bangladesh Poverty Annual Commercial Energy Consumption per Capita (kWh / person) Source: USDOE
Carbon Constraints The world is getting smaller, and fossil energy is a bigger target
World Energy-related Carbon Dioxide Emissions International Energy Outlook 2009
Energy in Kentucky • 92% of Ky electricity from coal • Ky is 1.4% of US population • Produces 2.3% of US Electricity • Ky uses 2% of US Energy • 1.7% Residential • 40% electric home heat vs 30% national average. • 2.7% Industrial • 1.4% Commercial • 3.7% Carbon Dioxide EIA, Oct 15, 2009
Carbon Management Can technology keep up with political reality?
Technology and InnovationCan Lead to Reductions in Carbon Emissions Reduce Population Reduce GDP Fuel Switching Improve Efficiency Sequester Carbon Capture & Storage Demand Side Natural Gas Enhance Natural Sinks Renewables Supply Side Nuclear Utilization or Conversion??? Photo art: A. Benlow
Reductions in Carbon EmissionsBy Adoption of New Power Generation Technologies PC (2000) IGCC (2000) Coal PC (2010) Generation Technology IGCC (2010) All Technologies with Sequestration Gas NGCC (2000) NGCC (2010) Percent Reduction in CO2 Emissions (Relative to Average PC Plant in 1999) Source: NETL, Scott Klara
Fuel Switching: Not a Simple Solution • Biofuelspresent new challenges • Monoculture, transportation, fossil infrastructure • Natural gas could become single fuel option • Heat, electricity, chemicals and food • Nuclear has unfortunate legacy • Solar is yet to be realized • Fossil energy is not going away soon • How do we extract with as little impact as possible • How do we return to beneficial state • How do we deal with emissions and wastes
Carbon Capture from fossil fuel power plants Algae Farm
Lowering the Energy Penalty of CO2 Capture • Post-Combustion Capture: PC + MEA (28-34%) • Steam consumption for stripper: 20% of gross power output • Booster fan and agent pump for MEA scrubber: 3-4% of gross power output • Pre-combustion Capture: IGCC (total 15-24%) • ASU + oxygen compression: 8-12% of gross power output • Selexol CO2 separation: 2% of gross power output • In-situ Capture: Oxy-Fuel Combustion (total 22-32%) • ASU: 15-20% of gross power output • Flue gas recirculation: 2% of gross power output • Possible CO2 further enrichment (unknown) ** Compression Train: 5-10% of gross power output Cost Related to CCS Capture: 60% Transport: 20% Injection &Storage: 20%
Current Status of IGCC • Mature technology for gasifier • New wave pushed by GE, Shell and ConocoPhillips • OEMs teamed with engineering companies to wrap • RD&D • New catalyst/shift-reactor process to reduce H2O/CO ratio • Membrane separation • Sorbent development • Process integration • Oxygen production
Current Status of Scrubbing • Amine: commercial-implementation on NG, food and chemical production • Kerr-McGee/ABB Lummus Crest Process • Fluor Daniel ECONAMINE FG Process • MHI’s KM-CDR process with KS solvent • Ongoing RD&D for utility flue gas • University of Texas at Austin • European Union integrated project “CO2 from Capture to Storage” (CASTOR) • International Test Center (ITC) at University of Regina, Canada • MHI • UK CAER • Ammonia: Commercial for fertilizer production • Ongoing RD&D for Utility’s flue gas • Alstom/EPRI 5MWth pilot plant at WE Energy - Pleasant Prairie Plant • Powerspan/NETL 1MWth slipstream at FirstEnergy’s Burger station • UK CAER/E-ON US 0.1MWth pilot plant
University of Kentucky Programs on carbon Management and STORAGE New technologies are necessary if Kentucky wants to compete in this new world.
CAER’s Post-combustion CO2 Capture Pilot Plant • Initiated by EON-US • $1.5 million grant • 0.1 MW(th) Pilot Scrubber System • Largest at a university • Platform for testing • New chemistries • New scrubber designs • Focus on lower energy penalty • Estimates of 60% cost increase • 1/3 power output of plant
Carbon Management Research Group • State-UK-Industry consortium • Build on E.ON US investment in carbon management and emissions control • Develop more energy and cost effective carbon management technologies • Address specific materials, controls and waste management solutions • Allow early adoption of technologies by Kentucky’s electric utilities • $1 Million/yr match provided by State • AEP/KP, Duke, EKPC, EON-US, EPRI • negotiating with others.
Development of an Algae System for Mitigation of CO2 from Coal-Fired Power Plants Center for Applied Energy Research Biosystems and Agricultural Engineering KY Department of Energy Development and Independence $3.5 million / 3 years EON has agreed to host demonstration phase
Algae for Carbon Capture • Uses CO2 as feedstock • Improved CO2 footprint for coal • Robust and easily produced • High solar efficiency • May have a high oil (lipid) content • As high as 65% by mass (dry) • Converts to biodiesel
Overall Process CO2Lean Gas Drying Biomass Fractionation Dewatering Algae Cultivation Media Proteins Carbohydrates Lipids RecoveredMedia Coal Power Plant Recovered Water Recovered Nutrients (N,P,K)
Algae Scrubber Demo http://www.caer.uky.edu/greenhouse/home.shtml 25
Carbon Sequestration Research *UK is cost sharing their F & A indirect costs of about $1.0 million **EON US, Peabody, ConocoPhillips, TVA
W Ky. Deep CO2 Injection Well Summary • KGS #1 Blan well drilled to 8,126 ft total depth in Hancock County • Successful injection tests into Knox Group • over 23,000 barrels water injected • 323 tons of CO2 injected at pump capacity (~7 hours) • Injection rates suggest high permeability fractures connect matrix porosity • Funding received from U.S. DOE for 2nd phase of research in 2010
What may happen? • We pay the penalties • 30-40% increase in generation (minimum) • 30% more coal mined • Delivered cost increases ~60% • We buy power
What should happen? • We change our model • Base regulation on efficiency • Allow “real future cost” in best price option • Clean Coal • We innovate • New technologies to deal with carbon • Efficiency improvements • Renewable and alternative Sources
Questions? For further information: Rodney Andrews UK Center for Applied Energy Research 2540 Research Park Drive Lexington, KY 40511 andrews@caer.uky.edu Ph 859-257-0305 www.caer.uky.edu