Download
1 / 2
20 likes | 191 Views
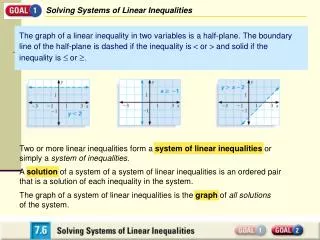
Solving a System of Linear Inequalities Graphically. To each given inequality we associate the line obtained by replacing the inequality sign by an = sign. This line splits the Cartesian Plane in two regions not containing the line. Then:

E N D
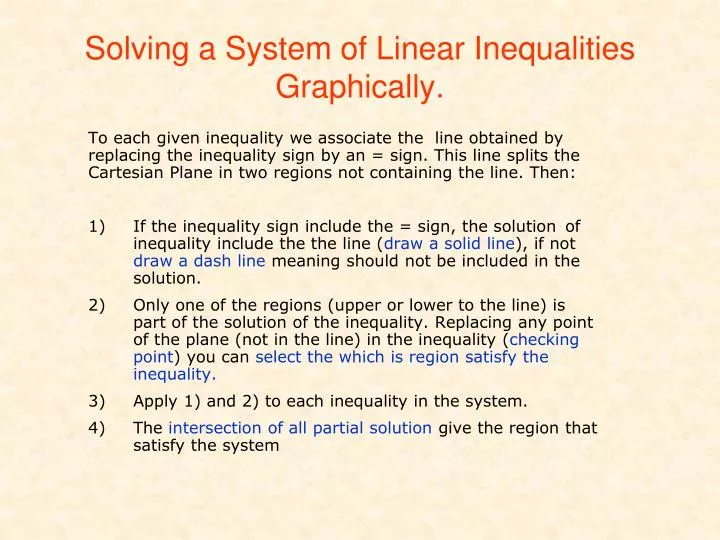
Solving a System of Linear Inequalities Graphically. To each given inequality we associate the line obtained by replacing the inequality sign by an = sign. This line splits the Cartesian Plane in two regions not containing the line. Then: 1) If the inequality sign include the = sign, the solution of inequality include the the line (draw a solid line), if not draw a dash line meaning should not be included in the solution. 2) Only one of the regions (upper or lower to the line) is part of the solution of the inequality. Replacing any point of the plane (not in the line) in the inequality (checking point) you can select the which is region satisfy the inequality. 3) Apply 1) and 2) to each inequality in the system. 4) The intersection of all partial solution give the region that satisfy the system
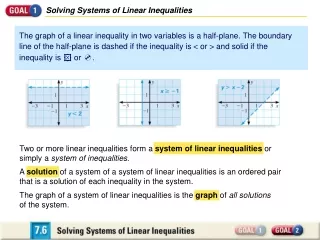
Solve, by graphing, y > x + 2 & 6y <= 2x +3 First draw the dash line y = x+2 , using (-2,0) & (2,0) Pick a checking point, for example (0,0). Substituting (0,0) in y > x + 2 you get 0 > 0+2False!so, select the region not containing the checking point, e.g. the upper side Secondly,draw the solid line 6y = 2x+3. Use, for example (-3/2,0) & (0,1/2). y > x + 2 (0,2) Pick (0,0) as checking point and substituting (0,0) in 6y <= 2x+3you get 0 <= 0+2True! , so, we select the region containing (0,0), e.g. the lower side. (0,1/2) (-2,0) (-3/2,0) Solution 6y <= 2x + 3 The intersection of the two selected sets is the graph solution of the system, e.g. the green set Checking Point