Download
1 / 39
390 likes | 568 Views
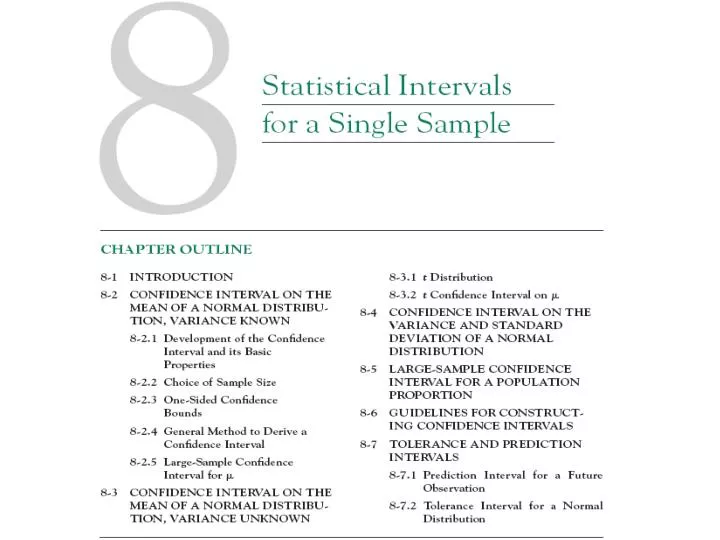
8-1 Introduction. In the previous chapter we illustrated how a parameter can be estimated from sample data. However, it is important to understand how good is the estimate obtained.

E N D
8-1 Introduction • In the previous chapter we illustrated how a parameter can be estimated from sample data. However, it is important to understand how good is the estimate obtained. • Bounds that represent an interval of plausible values for a parameter are an example of an interval estimate. • Three types of intervals will be presented: • Confidence intervals • Prediction intervals • Tolerance intervals
8-2 Confidence Interval on the Mean of a Normal Distribution, Variance Known 8-2.1 Development of the Confidence Interval and its Basic Properties
8-2 Confidence Interval on the Mean of a Normal Distribution, Variance Known 8-2.1 Development of the Confidence Interval and its Basic Properties
8-2 Confidence Interval on the Mean of a Normal Distribution, Variance Known • 8-2.1 Development of the Confidence Interval and its Basic Properties • The endpoints or bounds l and u are called lower- and upper-confidence limits, respectively. • Since Z follows a standard normal distribution, we can write:
8-2 Confidence Interval on the Mean of a Normal Distribution, Variance Known 8-2.1 Development of the Confidence Interval and its Basic Properties Definition
8-2 Confidence Interval on the Mean of a Normal Distribution, Variance Known Example 8-1
8-2 Confidence Interval on the Mean of a Normal Distribution, Variance Known • Interpreting a Confidence Interval • The confidence interval is a random interval • The appropriate interpretation of a confidence interval (for example on ) is: The observed interval [l, u] brackets the true value of , with confidence 100(1-). • Examine Figure 8-1 on the next slide.
8-2 Confidence Interval on the Mean of a Normal Distribution, Variance Known Figure 8-1Repeated construction of a confidence interval for .
8-2 Confidence Interval on the Mean of a Normal Distribution, Variance Known Confidence Level and Precision of Error The length of a confidence interval is a measure of the precision of estimation. Figure 8-2Error in estimating with .
8-2 Confidence Interval on the Mean of a Normal Distribution, Variance Known 8-2.2 Choice of Sample Size Definition
8-2 Confidence Interval on the Mean of a Normal Distribution, Variance Known Example 8-2
8-2 Confidence Interval on the Mean of a Normal Distribution, Variance Known 8-2.3 One-Sided Confidence Bounds Definition
8-2 Confidence Interval on the Mean of a Normal Distribution, Variance Known 8-2.4 General Method to Derive a Confidence Interval
8-2 Confidence Interval on the Mean of a Normal Distribution, Variance Known 8-2.4 General Method to Derive a Confidence Interval
8-2 Confidence Interval on the Mean of a Normal Distribution, Variance Known 8-2.4 General Method to Derive a Confidence Interval
8-2 Confidence Interval on the Mean of a Normal Distribution, Variance Known 8-2.5 A Large-Sample Confidence Interval for Definition
8-2 Confidence Interval on the Mean of a Normal Distribution, Variance Known Example 8-4
8-2 Confidence Interval on the Mean of a Normal Distribution, Variance Known Example 8-4 (continued)
8-2 Confidence Interval on the Mean of a Normal Distribution, Variance Known Example 8-4 (continued) Figure 8-3Mercury concentration in largemouth bass (a) Histogram. (b) Normal probability plot
8-2 Confidence Interval on the Mean of a Normal Distribution, Variance Known Example 8-4 (continued)
8-2 Confidence Interval on the Mean of a Normal Distribution, Variance Known A General Large Sample Confidence Interval
8-3 Confidence Interval on the Mean of a Normal Distribution, Variance Unknown 8-3.1 The t distribution
8-3 Confidence Interval on the Mean of a Normal Distribution, Variance Unknown 8-3.1 The t distribution Figure 8-4Probability density functions of several t distributions.
8-3 Confidence Interval on the Mean of a Normal Distribution, Variance Unknown 8-3.1 The t distribution Figure 8-5Percentage points of the t distribution.
8-3 Confidence Interval on the Mean of a Normal Distribution, Variance Unknown 8-3.2 The t Confidence Interval on One-sided confidence bounds on the mean are found by replacing t/2,n-1 in Equation 8-18 with t,n-1.
8-3 Confidence Interval on the Mean of a Normal Distribution, Variance Unknown Example 8-5
8-3 Confidence Interval on the Mean of a Normal Distribution, Variance Unknown Figure 8-6Box and Whisker plot for the load at failure data in Example 8-5.
8-3 Confidence Interval on the Mean of a Normal Distribution, Variance Unknown Figure 8-7Normal probability plot of the load at failure data in Example 8-5.
8-4 Confidence Interval on the Variance and Standard Deviation of a Normal Distribution Definition
8-4 Confidence Interval on the Variance and Standard Deviation of a Normal Distribution Figure 8-8Probability density functions of several 2 distributions.
8-4 Confidence Interval on the Variance and Standard Deviation of a Normal Distribution Definition
8-4 Confidence Interval on the Variance and Standard Deviation of a Normal Distribution One-Sided Confidence Bounds
8-4 Confidence Interval on the Variance and Standard Deviation of a Normal Distribution Example 8-6
8-7 Tolerance and Prediction Intervals 8-7.1 Prediction Interval for Future Observation The prediction interval for Xn+1 will always be longer than the confidence interval for .
8-7 Tolerance and Prediction Intervals Example 8-9
8-7 Tolerance and Prediction Intervals 8-7.2 Tolerance Interval for a Normal Distribution Definition
8-7 Tolerance and Prediction Intervals Example 8-10