Download
1 / 70
2.37k likes | 10.21k Views
Interpretation of Ventilator Graphics. Dr.Ahmed Abd Elmaksoud, MD. What is ventilator waveform?. Parameters displayed in waveform:. Volume Pressure Flow Time Exhaled P co 2. Physics review. A pressure difference ( ∆ p) must be present to make a fluid to flow

E N D
Interpretation of Ventilator Graphics Dr.Ahmed Abd Elmaksoud, MD
Parameters displayed in waveform: Volume Pressure Flow Time Exhaled Pco2
Physics review A pressure difference (∆p) must be present to make a fluid to flow The higher the pressure difference the higher the flow Flow is measured as the volume of the fluid passed a certain point in unit time,
Physics review The Resistance: It is the pressure difference divided by the flow caused by it
Physics review The Compliance: The compliance of a system is the volume change per unit change in pressure
Physics review The Work of Breathing: It is the pressure difference across the system multiplied by the volume of the fluid moved by it
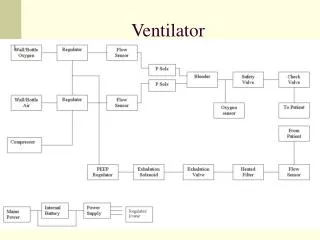
Ventilator Waveforms Depend on: Mode of ventilation Ventilator properties and settings Respiratory properties of the patient
Types of Ventilator Waveforms Scalar: Pressure – time Volume – time Flow – time Loops: Pressure – volume Volume – Flow Flow – pressure Trends:
Pressure – time curve Volume–oriented breath (modes) Pressure–oriented breath (modes)
Pressure – time curve Pressure – time curve shows airway pressure, breath timing, the breath type delivered and patient versus machine triggering
Pressure – time curve (volume – oriented mode) The level of pressure at “B” is affected by the resistance and the flow
Pressure – time curve (volume – oriented mode) The level of the plateau pressure is determined by the compliance and the tidal volume
Pressure – time curve (volume – oriented mode) Lung recruitment and leaks in the system are possible reasons for further slight decrease in pressure (points D to E).
Pressure – time curve (pressure – oriented mode) In pressure-oriented ventilation, Pressure increases rapidly from the lower pressure level until it reaches the upper pressure value and then remains constant for the inspiration time set on the ventilator.
Constant flow is a typical feature of a classic volume – oriented mode of ventilation. Flow – time curve
Decelerating flow is a typical feature of a pressure – oriented mode of ventilation. Flow – time curve
Flow – time curve • The course of the flow curve during inspiration is strongly influenced by the ventilation mode set on the ventilator • The course of the flow curve during expiration is influenced by the overall resistance and compliance of the lung and the system.
Volume – time curve • The transferred volume is calculated as the area underneath the flow curve • The maximum volume value is the transferred tidal volume (not the entire volume in the lung)
Pressure – volume loop Volume controlled ventilation
Pressure – volume loop Pressure controlled ventilation
Pressure – volume loop Pressure support ventilation
Pressure – volume loop Spontaneous ventilation
Pressure – volume loop The area to the left of the vertical axis (A) is a measure of how much work the patient needs to do to trigger the ventilator. The area to the right of the axis (B) represents the work done by the ventilator to support the patient
Pressure – volume loop As compliance decreases, and the ventilator settingsremain the same, the PV loop in volume-controlled ventilation takes an increasingly flat course.
Pressure – volume loop The change in resistance during constant flow ventilation changes the position of the inspiratory branch of the loop while its steepness remains unchanged
Pressure – volume loop A change in the height of the PV loop is a measure of the strength of the patient’s inspiratory effort (if the ventilator parameters are unchanged)
Pressure – volume loop PV loops measured before and after resistances
Pressure – volume loop The work of breathing can be much greater than what is displayed in PV loops if the pressure is measured before resistances
Pressure – volume loop The reason for setting assisted spontaneous breathing is generally to try to compensate for these airway resistance
Volume – flow loop Changes in the shape of volume – flow loop are used to obtain information about airway resistance
Volume – flow loop Increased airway resistance due to increased secretions
Trends • Graphic trend displays enable ventilation processes to be assessed at a later stage. • An event which occurs suddenly calls for as much details as possible to be shown in the diagram; while assessing the process of weaning, for example, needs several days or even weeks to be displayed in one diagram.