Download
1 / 35
350 likes | 434 Views
A Core Course on Modeling. Week 3 – Time for Change. Enter: ACCEL basics running a script Time in ACCEL the { … } operator examples. A Core Course on Modeling. Week 3 – Time for Change. ACCEL. intro and PR line-by-line, navigate a script assistance enter a script as text

E N D
A Core Course on Modeling Week 3 – Time for Change • Enter: ACCEL • basics • running a script • Time in ACCEL • the { … } operator • examples
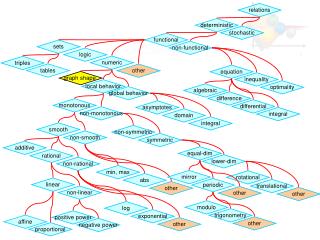
A Core Course on Modeling Week 3 – Time for Change ACCEL • intro and PR • line-by-line, navigate a script • assistance • enter a script as text • numerical analysis • optimization • larger view on simulation output
A Core Course on Modeling Week 3 – Time for Change ACCEL 3 Example of a script: p=5 q=slider(10,0,20) r=p+q paste into IO/edit box click ‘run’ Every line introduces a quantity Quantities can be constants (p) Quantities can be functions r = f(p,q) Quantities can be user-entered (q)
A Core Course on Modeling Week 3 – Time for Change ACCEL 4 If something STRANGE happens: • don't panic • goto IO/edit • ctrl-A (select all) • ctrl-C (copy all) • ctrl-V into text editor to save your script • reload ACCEL • goto IO/edit • ctrl-V to load script into ACCEL • retry image: http://partlycloudyjuly.wordpress.com/2011/02/25/look-both-ways/
A Core Course on Modeling Week 3 – Time for Change ACCEL 5 Example of a script with comment: s=slider(10,0,20) // this is a slider r=p+q // this is an expression p=5 // this is a constant q=s+t // this is an expression t=pow(s,3) // this is a standard // function to see values: click ‘show/hide values’ to see dependencies: click on ‘pauze’, next click on any quantity
A Core Course on Modeling Week 3 – Time for Change ACCEL 6 Example of a script with visual output: s=slider(10,0,100) z=plot([gr1,gr2]) gr1=[str,[s]] gr2=[str,[s % 10]] str='x:{mode:intp},y:{mode:shift,ref:1}' plot([graph1,graph2,…, graphn]) plots n graphs graphi = [format,data] format = string, e.g. ' x:{mode:intp},y:{mode:shift,ref:1}' data = one or more quantities Black Magic for now …
A Core Course on Modeling Week 3 – Time for Change time in ACCEL 7 Remember recursive functions: Qcurrent = f (Qprev, Pprev) Simplest example: timecurrent = timeprev + 1 Start conditions: ACCEL initializes all quantities to 0
A Core Course on Modeling Week 3 – Time for Change time in ACCEL 8 p=t t=t{1}+1 ACCEL uses {1} to access previous value ACCEL uses {n} to access n-th previous value, n>0 ACCEL initializes after modification in script
A Core Course on Modeling Week 3 – Time for Change time in ACCEL 9 p=k k=if(t>0,k{1}+5,0) t=t{1}+1 ACCEL can be forced to re-initialize after nr steps:
A Core Course on Modeling Week 3 – Time for Change time in ACCEL 10 z=plot([gr1,gr2]) gr1=[str1,[s]] gr2=[str2,[50+s-s{1}]] s=50+25*sin(t/10) str1='width:{value:10},col_r:{value:255},x:{mode:intp},y:{mode:shift,ref:1}' str2='width:{value:10},col_b:{value:255},x:{mode:intp},y:{mode:shift,ref:1}' t=t{1}+1 Implement first derivative image: http://www.treklens.com/gallery/photo593123.htm
A Core Course on Modeling Week 3 – Time for Change time in ACCEL 11 z=plot([gr1,gr2]) gr1=[if(rate<0,str1,str2),[50+10*rate]] gr2=[str3,[50+supply]] rate=slider(0,-0.5,0.5) supply=supply{1}+rate str1='width:{value:10},col_r:{value:255},x:{mode:intp},y:{mode:shift,ref:1}' str2='width:{value:10},col_g:{value:255},x:{mode:intp},y:{mode:shift,ref:1}' str3='width:{value:10},col_b:{value:255},x:{mode:intp},y:{mode:shift,ref:1}' Implement integral image: http://www.themarketingexpert.net/2011/12/leaky-bucket.html
A Core Course on Modeling Week 3 – Time for Change time in ACCEL 12 z=plot([gr1,gr2]) gr1=[str1,[s]] gr2=[str2,[ds]] s=slider(50,0,100) ds=(1-damp)*s+damp*ds{1} damp=slider(0.5,0.01,0.99) str1='width:{value:10},col_r:{value:255},x:{mode:intp},y:{mode:shift,ref:1}' str2='width:{value:10},col_b:{value:255},x:{mode:intp},y:{mode:shift,ref:1}' Implement damping image: http://www.acecontrols.co.uk/product-range
A Core Course on Modeling Week 3 – Time for Change time in ACCEL 13 z=plot([gr1,gr2]) gr1=[str1,[s]] gr2=[str2,[ds]] s=slider(50,0,100) ds=s{delay} delay=slider(1,1,100) str1='width:{value:10},col_r:{value:255},x:{mode:intp},y:{mode:shift,ref:1}' str2='width:{value:10},col_b:{value:255},x:{mode:intp},y:{mode:shift,ref:1}' Implement delay image: http://www.rainbowresource.com/prodlist.php?subject=20&category=8753
A Core Course on Modeling Week 3 – Time for Change time in ACCEL 14 Equal intervals: a mass-spring system with damping. From physics, we know K=ma where K=C(urest-u) and a=u’’. Write v=u’, then a=v’. Here, K=K(t), u=u(t). Let us approximate by sampling. For 0: t i K(t) Ki u(t) ui u’(t) (u(t+)-u(t))/ = (ui+1-ui)/ v’(t) (v(t+)-v(t))/ = (vi+1-vi)/ So ui+1= ui+vi vi+1= vi+ai = = vi+Ki/m = = vi+ C(urest-ui) /m Recursive function Qcurr=F(Qprev,Pprev): ucurr=F1(uprev,vprev)=uprev+vprev vcurr=F2(vprev,uprev)= =vprev+ C(urest-uprev) /m, with suitable u0 and v0 out
A Core Course on Modeling Week 3 – Time for Change time in ACCEL 15 Equal intervals: a mass-spring system with damping. From physics, we know K=ma where K=C(urest-u) and a=u’’. Write v=u’, then a=v’. Here, K=K(t), u=u(t). Let us approximate by sampling. For 0: t i K(t) Ki u(t) ui u’(t) (u(t+)-u(t))/ = (ui+1-ui)/ v’(t) (v(t+)-v(t))/ = (vi+1-vi)/ So ui+1= ui+vi vi+1= vi+ai = = vi+Ki/m = = vi+ C(urest-ui) /m Recursive function Qcurr=F(Qprev,Pprev): ucurr=F1(uprev,vprev)=uprev+vprev vcurr=F2(vprev,uprev)= =vprev+ C(urest-uprev) /m, with suitable u0 and v0 out -v ( -vi) ( -vprev)
A Core Course on Modeling Week 3 – Time for Change time in ACCEL 16 Equal intervals WARNING: 0 is not the same as '=small'. The substitutions for u’(t) and v’(t) are approximations only. As we will see in a later example, aliasing errors are worse when the sampled signal changes rapidly, compared to the sampling rate. Concrete: unless is much smaller than the period of the oscillation (=m/C), the approximations are bad – with the risk of instability.
A Core Course on Modeling Week 3 – Time for Change time in ACCEL 17 Infinitesimal intervals the mass-spring system with damping revisited. From physics, we know K=ma where K=C(urest-u) and a=u’’. For some purposes the numerical solution (sampling) is not acceptable. Interested in outcome? use better numerical methods Interested in insight? try to use symbolic methods, i.e.: analysing differential equations Only possible in very few special cases In particular: linear (sets of) DE’s. out
A Core Course on Modeling Week 3 – Time for Change time in ACCEL 18 Infinitesimal intervals the mass-spring system with damping revisited. From physics, we know K=ma where K=C(urest-u) and a=u’’. Here, K=K(t), u=u(t). Let us try a solution of the form u=urest+A sin(t/T) u’’= -AT-2sin(t/T) Substitute back: -mAT-2sin(t/T)=C(urest-urest-Asin(t/T) ), mT-2=C, or T= m/C ( =:T0) out
A Core Course on Modeling Week 3 – Time for Change time in ACCEL 19 Infinitesimal intervals the mass-spring system with damping revisited. From physics, we know K=ma where K=C(urest-u) and a=u’’. Here, K=K(t), u=u(t). try u=urest+Aet, then C++m2=0, or 1,2=(- (2-4mC))/2m Let 0=(4mC). For = 0 critical damping; for < 0 oscillations; T=T0/(1- ( /0)2) for > 0 super critical damping (further details: lectures ‘dynamical systems’) out -v By substituting u = Aet into C(urest-u)-u’=mu’’ and using u’=Aet; u’’=A2et. C(urest-urest-Aet)- Aet=mA2et Must hold for any t, so indeed C + + m2=0
user input graphics force and acceleration exact solution recursive functions A Core Course on Modeling Week 3 – Time for Change time in ACCEL 20 A mass-spring system c=slider(5,1,20.0) delta=slider(0.1,0.001,0.2) m=slider(5,1,10) mu=slider(0,0,1.5) reset=button() z=plot([gr1,gr2]) str1='width:{value:10},col_r:{value:255},x:{mode:intp},y:{mode:shift,ref:1}' str2='width:{value:10},col_b:{value:255},x:{mode:intp},y:{mode:shift,ref:1}' gr1=[str1,[40+10*u]] gr2=[str2,[45+10*u_exact]] F=-c*u{1}-mu*v{1} a=F/m discr=mu*mu-4*m*c lambda_img=cond(discr>0,0,sqrt(-discr)/(2*m)) lambda_real=cond(discr>0,(-mu+sqrt(discr))/(2*m),-mu/(2*m)) u_exact=cond(discr>0,exp(lambda_real*t),exp(lambda_real*t)*cos(lambda_img*t)) t=if(reset,0,t{1}+delta) u=if(reset,1,u{1}+delta*v) v=if(reset,0,v{1}+delta*a)
A Core Course on Modeling Week 3 – Time for Change time in ACCEL 21 y(t) = vy t + gt2/2 x(t) = vx t y(t) = 0 , so t = 2 vy / g Then x = 2 vx vy / g 2 (cos sin ) / g = sin 2 /g Maximize x: = 45o But what in case of damping? y x http://thehumanmarvels.com/1634/zazel-the-human-cannonball/talents A cannon shot simulation
A Core Course on Modeling Week 3 – Time for Change time in ACCEL 22 airDamp=slider(0.005,0,0.03) dt=slider(0.1,0.02,40.0) phi=slider(0,0,1.5) plotBall=plot([['plotType:bubble,x:{mode:data,ref:1},y:{mode:data,ref:2},diameter:{value:5}',[r.x],[r.y]]]) px=r.x g=-0.003 groundDamp=0.02 v=0.55 boom=(r{1}.vx<0.000001) newVx=r{1}.vx*(1-velDamp*dt) newVy=r{1}.vy+(g-velDamp*r{1}.vy)*dt newX=min(r{1}.x+dt*r{1}.vx,100) newY=max(r{1}.y+dt*r{1}.vy,0) r=if(boom,startR,simR) simR=['x':newX,'y':newY,'vx':newVx,'vy':newVy] startR=['x':0,'y':20,'vx':v*cos(phi),'vy':v*sin(phi)] velDamp=if(r{1}.y>0,airDamp,groundDamp) A cannon shot simulation
A Core Course on Modeling Week 3 – Time for Change time in ACCEL 23 Lanchester's Law: e1 : nr troops of army 1 e2: nr troops of army 2 1: relative strength of 1 2 : relative strength of 2 then de1/dt = - 2 e2 de2/dt = - 1e1 Given e1(t=0)=e10, e2(t=0)=e20, who wins? http://www.napolun.com/mirror/napoleonistyka.atspace.com/default.htm A combat simulation
A Core Course on Modeling Week 3 – Time for Change time in ACCEL 24 p=check(true) e1=if(p,e1_0,max(0,e1{1}-lambda_2*e2{1})) e2=if(p,e2_0,max(0,e2{1}-lambda_1*e1{1})) lambda_1=slider(0.01,0,0.02) lambda_2=slider(0.01,0,0.02) e1_0=slider(100,0,500) e2_0=slider(100,0,500) res=plot([graph1,graph2]) graph1=['x:{mode:intp},y:{mode:shift,ref:1},col_r:{value:255}',[e1/5]] graph2=['x:{mode:intp},y:{mode:shift,ref:1},col_g:{value:255}',[e2/5]] A combat simulation
A Core Course on Modeling Week 3 – Time for Change time in ACCEL 25 Lotka – Volterra model: br = birth rate of rabit (autonomous) bf = birth rate of fox, feeding on rabit dr = rabits killed by fox df = death rate of fox (autonomous) r / t = r (br – dr f) f / t = f (bf r – df ) http://q-rai.deviantart.com/ A predator - prey simulation
user input time graphics A Core Course on Modeling Week 3 – Time for Change time in ACCEL 26 bf=slider(1.5,0,5) br=slider(3,0,5) df=slider(1,0,5) dr=slider(1,0,5) dt=slider(0.15,0.01,0.2) reset=button() p=plot([gboth,gfox,grab]) gboth=['nPoints:50,plotType:bubble,diameter:{value:5},col_r:{mode:shift,ref:3},x:{mode:shift,ref:1},y:{mode:shift,ref:2}',10+3*[f],10+3*[r],[50]] gfox=['y:{mode:intp},x:{mode:shift,ref:1},width:{value:5},col_r:{value:255}',10+3*[f]] grab=['x:{mode:intp},y:{mode:shift,ref:1},width:{value:5},col_b:{value:255}',10+3*[r]] f=if((time<2)||reset,150,max(0.01,f{1}+dt*(bf*f{1}*r{1}-df*f{1}))) r=if((time<2)||reset,150,max(0.01,r{1}+dt*(br*r{1}-dr*f{1}*r{1}))) time=time{1}+1 recursive functions A predator - prey simulation
A Core Course on Modeling Week 3 – Time for Change time in ACCEL 27 … introduce fox hunt when too many fox bf=slider(1.5,0,5) br=slider(3,0,5) df=slider(1,0,5) dr=slider(1,0,5) dt=slider(0.15,0.01,0.2) reset=button() fLimit=slider(20,0,20) fShoot=slider(1,0,20) p=plot([gboth,gfox,grab]) gboth=['nPoints:50,plotType:bubble,diameter:{value:5},col_r:{mode:shift,ref:3},x:{mode:shift,ref:1},y:{mode:shift,ref:2}',10+3*[f],10+3*[r],[50]] gfox=['y:{mode:intp},x:{mode:shift,ref:1},width:{value:5},col_r:{value:255}',10+3*[f]] grab=['x:{mode:intp},y:{mode:shift,ref:1},width:{value:5},col_b:{value:255}',10+3*[r]] fH=if((time<2)||reset,150,max(0.01,fH{1}+dt*(bf*fH{1}*r{1}-df*fH{1}))) f=if(fH{1}>fLimit,max(0,fH{1}-fShoot),fH{1}) r=if((time<2)||reset,150,max(0.01,r{1}+dt*(br*r{1}-dr*f{1}*r{1}))) time=time{1}+1 A predator - prey simulation
A Core Course on Modeling Week 3 – Time for Change time in ACCEL 28 … color hunt-incidents bf=slider(1.5,0,5) br=slider(3,0,5) df=slider(1,0,5) dr=slider(1,0,5) dt=slider(0.15,0.01,0.2) reset=button() fLimit=slider(20,0,20) fShoot=slider(1,0,20) p=plot([gboth,gfox,grab]) gboth=['nPoints:50,plotType:bubble,diameter:{value:5},col_r:{mode:shift,ref:3},x:{mode:shift,ref:1},y:{mode:shift,ref:2}',10+3*[f],10+3*[r],[color]] gfox=['y:{mode:intp},x:{mode:shift,ref:1},width:{value:5},col_r:{value:255}',10+3*[f]] grab=['x:{mode:intp},y:{mode:shift,ref:1},width:{value:5},col_b:{value:255}',10+3*[r]] fH=if((time<2)||reset,150,max(0.01,fH{1}+dt*(bf*fH{1}*r{1}-df*fH{1}))) f=if(fH{1}>fLimit,max(0,fH{1}-fShoot),fH{1}) r=if((time<2)||reset,150,max(0.01,r{1}+dt*(br*r{1}-dr*f{1}*r{1}))) color=if(fH{1}>fLimit,255,0) time=time{1}+1 A predator - prey simulation
A Core Course on Modeling Week 3 – Time for Change time in ACCEL 29 … shoot fox when too few rabits bf=slider(1.5,0,5) br=slider(3,0,5) df=slider(1,0,5) dr=slider(1,0,5) dt=slider(0.15,0.01,0.2) reset=button() fLimit=slider(20,0,20) fShoot=slider(1,0,20) p=plot([gboth,gfox,grab]) gboth=['nPoints:50,plotType:bubble,diameter:{value:5},col_r:{mode:shift,ref:3},x:{mode:shift,ref:1},y:{mode:shift,ref:2}',10+3*[f],10+3*[r],[color]] gfox=['y:{mode:intp},x:{mode:shift,ref:1},width:{value:5},col_r:{value:255}',10+3*[f]] grab=['x:{mode:intp},y:{mode:shift,ref:1},width:{value:5},col_b:{value:255}',10+3*[r]] fH=if((time<2)||reset,150,max(0.01,fH{1}+dt*(bf*fH{1}*r{1}-df*fH{1}))) f=if(r {1}<fLimit,max(0,fH{1}-fShoot),fH{1}) r =if((time<2)||reset,150,max(0.01,r {1}+dt*(br*r {1}-dr*f{1}*r {1}))) color=if(r{1}<fLimit,255,0) time=time{1}+1 A predator - prey simulation
A Core Course on Modeling Week 3 – Time for Change time in ACCEL 30 bf=slider(1.5,0,5) br=slider(3,0,5) df=slider(1,0,5) dr=slider(1,0,5) dt=slider(0.15,0.01,0.2) reset=button() p=plot([gboth,gfox,grab]) f=if((time<2)||reset,150,max(0.01,f{1}+dt*(bf*f{1}*r{1}-df*f{1}))) gboth=['nPoints:50,plotType:bubble,diameter:{value:5},col_r:{mode:shift,ref:3},x:{mode:shift,ref:1},y:{mode:shift,ref:2}',10+3*[f],10+3*[r],[50]] gfox=['y:{mode:intp},x:{mode:shift,ref:1},width:{value:5},col_r:{value:255}',10+3*[f]] grab=['x:{mode:intp},y:{mode:shift,ref:1},width:{value:5},col_b:{value:255}',10+3*[r]] r=if((time<2)||reset,150,max(0.01,r{1}+dt*(br*r{1}-dr*f{1}*r{1}))) time=time{1}+1 A predator - prey simulation
A Core Course on Modeling Week 3 – Time for Change time in ACCEL 31 bf=slider(1.5,0,5) br=slider(3,0,5) df=slider(1,0,5) dr=slider(1,0,5) dt=slider(0.15,0.01,0.2) reset=button() p=plot([gboth,gfox,grab]) plf=f plr=r r=if((time<2)||reset,150,max(0.01,r{1}+dt*(br*r{1}-dr*f{1}*r{1}))) f=if((time<2)||reset,150,max(0.01,f{1}+dt*(bf*f{1}*r{1}-df*f{1}))) gboth=['nPoints:50,plotType:bubble,diameter:{value:5},x:{mode:shift,ref:1},y:{mode:shift,ref:2}',10+3*[f],10+3*[r]] gfox=['y:{mode:intp},x:{mode:shift,ref:1},width:{value:5},col_r:{value:255}',10+3*[f]] grab=['x:{mode:intp},y:{mode:shift,ref:1},width:{value:5},col_b:{value:255}',10+3*[r]] time=time{1}+1 A predator - prey simulation
A Core Course on Modeling Week 3 – Time for Change time in ACCEL 32 v'w v'r http://joyreactor.com/tag/billiards ; ||||=1 r w= - r = =: = (vw-vr , ) vr vw A billiards simulation
A Core Course on Modeling Week 3 – Time for Change time in ACCEL 33 v'w v'r ; ||||=1 r w= - r = =: = (vw-vr , ) vr vw Proof: Energy conservation: vr2+vw2=(vr+)2+(vw-)2, hence vr2+vw2=(vr+)2+(vw-)2, hence 0=(2(vr, )+2)+(-2(vw, )+2), hence = (vw-vr, ), QED A billiards simulation
A Core Course on Modeling Week 3 – Time for Change time in ACCEL 34 v'w v'r ; ||||=1 r w= - r = =: = (vw-vr , ) vr vw Proof: Energy conservation: vr2+vw2=(vr+)2+(vw-)2, hence vr2+vw2=(vr+)2+(vw-)2, hence 0=(2(vr, )+2)+(-2(vw, )+2), hence = (vw-vr, ), QED v'r=vr+(vw-vr , ) v'w=vw+(vr-vw , ) A billiards simulation
A Core Course on Modeling Week 3 – Time for Change time in ACCEL 35 … and a further handfull of details maxX=40 minX=-40 maxY=25 minY=-25 halfWay=50 // half of the screen; used to correct the queueX and queueY coordinates help=check(false) // plot the direction of the queue nBalls=3 // nr balls // This is also hard coded in the colors; if the nr balls should change, only the color // arrays have to be updated rhoBall=slider(1.4,0.6,4) // radius of the balls mBall=5 // mass of the balls time=time{1}+1 rollDamp=0.994 // the damping coefficient for the rolling balls collDamp=0.6 // the damping coefficient for colliding balls eThreshold=0.5 // the minimum kinetic energy for the balls to stay rolling dT=0.8 // to go from physical time to simulation time PR=plot([plotTable,plotShadow,plotBalls,plotHighLight,plotQueue,plotQueue2]) // one graph consisting of three balls. The x and y coordinates are // taken from the 'x'- and 'y'-components of the r-vector that has to be transposed in order to get // the x-s and y-s in two separate vectors. tVec(i,j)=@(r{1},j)-@(r{1},i) // the vector pointing from ball i to ball j, with coefficients x and y cpl=#(i,vSequence(0,nBalls),cplOneBall(i),vAppend) // the couplings matrix containing all info about the relations to ball i, // that is: 'close' to indicate if these two balls are in a collision-state; // if close is true, 'force' is the current reaction force between them. tMat=#(i,vSequence(0,nBalls),tMatOneBall(i),vAppend) // the tMatrix contains, for every pair, i-j, the t-vector between the centres tMatOneBall(i)=#(j,vSequence(0,nBalls),tVec(i,j),vAppend) // the tMatOneBall vector contains, for every ball, // the the t-vectors between its centre and the other centres touch(i,j)=((vNormEuclid(@(@(tMat,i),j))<(@(rho,i)+@(rho,j))) && (i!=j) && vDot(@(@(tMat,i),j),@(p{1},i)/@(m,i)-@(p{1},j)/@(m,j))>0) // condition for colliding contact. Three terms: // 1. Are the balls close enough? // 2. No self-collision? // 3. Is the relative velocity opposite to the vector connecting the centres? cplOneBall(i)=#(j,vSequence(0,nBalls),cond(touch(i,j),['close':true,'force':(mpt(i,j)/m1m2tt(i,j))*@(@(tMat,i),j)],['close':false,'force':0]),vAppend) // the cplOneBall vector contains, for ball i, the info for the collisions between this // ball and all other balls. // It sets the value to the boolean 'close', and if close==true, the // current force vector. The derivation of the force vector // is based on conservation of momentum, angular momentum and kinetic energy // in a coordinate-free version. mpt(i,j)=-2*vDot(@(m,j)*@(p{1},i)-@(m,i)*@(p{1},j),@(@(tMat,i),j)) // the product (((m1p2-m2p1)t),t): the numerator of the force vector m1m2tt(i,j)=(@(m,i)+@(m,j))*vDot(@(@(tMat,i),j),@(@(tMat,i),j)) // the product (m1+m2)(t,t): the denominator of the force vector f=#(i,vSequence(0,nBalls),forceOnOneBall(i),vAppend) // calculate the forces for all balls by concatenating forceOnOneBall(i)=#(j,vSequence(0,nBalls),cond(@(@(@(cpl,i),j),'close'),@(@(@(cpl,i),j),'force'),0),add) // adding the forces due to all other of balls rho=#(i,vSequence(0,nBalls),rhoBall,vAppend) // the radii of the balls m=#(i,vSequence(0,nBalls),mBall,vAppend) // the mass of the balls col=['red':[255,255,255],'grn':[0,255,255],'blu':[0,255,0]] // colors of the balls: first one is red, two is white, three is yellowish r=if(gameState=='roll',r{1}+dT*p/m,cond(time==1,#(i,vSequence(0,nBalls),['x':halfWay*(random()-0.5),'y':0.5*halfWay*(random()-0.5)],vAppend),r{1})) // r is obtained by integrating v; at the starting time (==1) give the initial random positions p=if(gameState=='roll',rollDamp*wallCollide(p{1}+f),[['x':0,'y':0],['x':@(@(r{1},1),'x')-queueX,'y':@(@(r{1},1),'y')-queueY],['x':0,'y':0]]) // p is obtained by tame integrating f; at the starting time give the initial momenta. The only // non-vanishing initial momentum is the momentum of ball 1; this is obtained from the queue position minus the centre of ball 1. wallCollide(a)=wallCollideLeft(wallCollideRight(wallCollideBottom(wallCollideTop(a)))) // the collisions with all walls wallCollideLeft(a)=#(i,vDom(a),cond((@(@(r{1},i),'x')>(minX+@(rho,i))) || (@(@(a,i),'x')>0),@(a,i),['x':-collDamp*@(@(a,i),'x'),'y':collDamp*@(@(a,i),'y')]),vAppend) // collide left wall wallCollideRight(a)=#(i,vDom(a),cond((@(@(r{1},i),'x')<(maxX-@(rho,i))) || (@(@(a,i),'x')<0),@(a,i),['x':-collDamp*@(@(a,i),'x'),'y':collDamp*@(@(a,i),'y')]),vAppend) // collide right wall wallCollideBottom(a)=#(i,vDom(a),cond((@(@(r{1},i),'y')>(minY+@(rho,i))) || (@(@(a,i),'y')>0),@(a,i),['x':collDamp*@(@(a,i),'x'),'y':-collDamp*@(@(a,i),'y')]),vAppend) // collide bottom wall wallCollideTop(a)=#(i,vDom(a),cond((@(@(r{1},i),'y')<(maxY-@(rho,i))) || (@(@(a,i),'y')<0),@(a,i),['x':collDamp*@(@(a,i),'x'),'y':-collDamp*@(@(a,i),'y')]),vAppend) // collide top wall eKin=#(i,vSequence(0,nBalls),vDot(@(p,i),@(p,i))/(2*@(m,i)),add) // the kinetic energy gameState=cond((eKin{1}<eThreshold) && !queueHit,'hit',cond(queueHit,'roll','hit')) // determine which state we are in queueHit=cursorB() cX=cursorX() cY=cursorY() queueX=cX-halfWay queueY=cY-halfWay // the queue end position is derived from the location of the cursor plotQueue=cond(gameState=='hit',['plotType:line,col_b:{value:0},col_g:{value:0},col_r:{value:0},x:{mode:data,ref:1},y:{mode:data,ref:2}',halfWay+[queueX,@(@(r{1},1),'x')],halfWay+[queueY,@(@(r{1},1),'y')]],['plotType:line,x:{mode:data,ref:1},y:{mode:data,ref:2}',[0,0],[0,0]]) plotQueue2=cond(gameState=='hit' && help,['plotType:line,col_g:{value:100},col_r:{value:0},width:{value:0.4},x:{mode:data,ref:1},y:{mode:data,ref:2}',halfWay+[10*(@(@(r{1},1),'x')-queueX)+queueX,@(@(r{1},1),'x')],halfWay+[10*(@(@(r{1},1),'y')-queueY)+queueY,@(@(r{1},1),'y')]],['plotType:line,x:{mode:data,ref:1},y:{mode:data,ref:2}',[0,0],[0,0]]) // the queue is drawn when in hit-mode plotTable=['plotType:vbar,yBase:{value:25},width:{value:80},height:{value:50},col_r:{value:0}',[]] // plot the table plotBalls=['plotType:bubble,x:{mode:data,ref:1},y:{mode:data,ref:2},diameter:{mode:data,ref:3},col_r:{mode:data,ref:4},col_g:{mode:data,ref:5},col_b:{mode:data,ref:6}',halfWay+@(vTranspose(r),'x'),halfWay+@(vTranspose(r),'y'),2*rho,@(col,'red'),@(col,'grn'),@(col,'blu')] // plot the balls plotShadow=['plotType:bubble,x:{mode:data,ref:1},y:{mode:data,ref:2},diameter:{value:'+2*rhoBall+'},col_r:{value:0},col_g:{value:0},col_b:{value:0},col_a:{value:0.5}',halfWay-0.15*rhoBall+@(vTranspose(r),'x'),halfWay-0.5*rhoBall+@(vTranspose(r),'y')] // plot the shadows beneath the balls plotHighLight=['plotType:bubble,x:{mode:data,ref:1},y:{mode:data,ref:2},diameter:{value:'+0.75*rhoBall+'},col_r:{value:255},col_g:{value:255},col_b:{value:255}',halfWay+0.1*rhoBall+@(vTranspose(r),'x'),halfWay+0.5*rhoBall+@(vTranspose(r),'y')] // plot the highlights on the balls A billiards simulation