Download
1 / 15
160 likes | 424 Views
Graphs of Polar Equations. Dr .Hayk Melikyan Departmen of Mathematics and CS melikyan@nccu.edu. . . 2. 2. 3. 3 . 3. 4. 4. ˝. 5 . 6. 6. . 0. 2. 4. 7 . 11 . 6. 6. 5 . 7 . 4. 4. 4 . 5 . 3 . 3. 3. 2. Using Polar Grids to Graph Polar Equations.

E N D
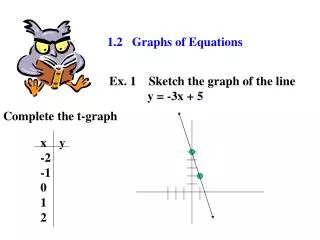
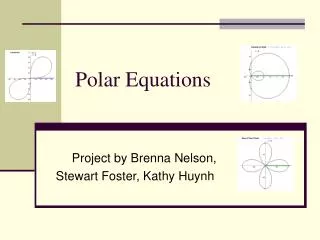
Graphs of Polar Equations Dr .Hayk Melikyan Departmen of Mathematics and CS melikyan@nccu.edu
2 2 3 3 3 4 4 ˝ 5 6 6 0 2 4 7 11 6 6 5 7 4 4 4 5 3 3 3 2 Using Polar Grids to Graph Polar Equations Recall that a polar equation is an equation whose variables are r and è. The graph of a polar equation is the set of all points whose polar coordinates satisfy the equation. We use polar grids like the one shown to graph polar equations. The grid consists of circles with centers at the pole. This polar grid shows five such circles. A polar grid also shows lines passing through the pole, In this grid, each fine represents an angle for which we know the exact values of the trigonometric functions.
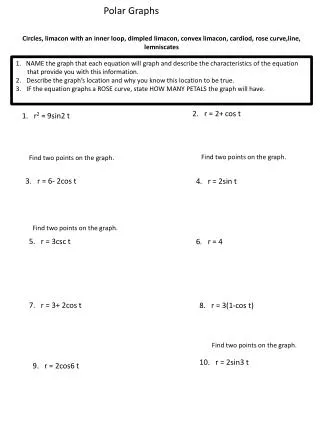
(2, /3) r = 4 cos (r, ) 2 2 ˝ 3 3 3 0 4 cos 0 = 4 • 1 = 4 (4, 0) 4 4 5 /6 4 cos /6 = 4 •3/2=2 3=3.5 (3.5, /6) 6 6 (0, /2) (3.5, /6) /3 4 cos /3 = 4 • 1/2 = 4 (2, /3) ˝ 0 2 4 /2 4 cos /2 = 4 • 0 = 0 (0, /2) (4, 0) or (-4, ) 7 11 2 /3 4 cos2 /3 = 4(- 1/2) = -2 (-2, 2 /3) 6 6 5 7 (-2, 2 /3) 5/6 4 cos5 /6 = 4(- 3/2)=-2 3=-3.5 (-3.5,5/6) 4 4 4 5 3 3 3 ˝ 4 cos ˝ = 4(-1) = -4 (-4, ) 2 (-3.5, 5/6) Text Example • Graph the polar equation r = 4 cos with in radians. Solution We construct a partial table of coordinates using multiples of p6. Then we plot the points and join them with a smooth curve, as shown.
/2 /2 a ˝ 0 ˝ 0 a 3 /2 3 /2 Circles in Polar Coordinates The graphs of r = a cos and r = a sin Are circles. r = a cos r = a sin
Text Example • Check for symmetry and then graph the polar equation:r= 1 - cos . Solution We apply each of the tests for symmetry. Polar Axis: Replace by - inr= 1 - cos : r= 1 - cos (- ) Replace by - inr= 1 - cos . r= 1 - cos The cosine function is even: cos (- ) = cos . Because the polar equation does not change when is replaced by - , the graph is symmetric with respect to the polar axis.
Text Example cont. Solution The Line =p2: Replace (r, ) by (-r, - ) inr= 1 - cos : -r= 1 - cos(-) Replace r by -r and by – in -r= 1 - cos(- ). -r= 1 – cos cos(- ) = cos . r= cos - 1 Multiply both sides by -1. Because the polar equationr= 1 - cos changes tor= cos - 1 when (r, ) is replaced by (-r, - ), the equation fails this symmetry test. The graph may of may not be symmetric with respect to the line =p2. The Pole: Replace r by -r inr= 1 - cos : -r= 1 – cos Replace r by –r. r= cos - 1 Multiply both sides by -1. Because the polar equationr= 1 - cos changes tor= cos - 1 whenris replaced by -r, the equation fails this symmetry test. The graph may or may not be symmetric with respect to the pole.
p 0 p/6 p/3 p2 2p/3 5p/6 p ˝ 2 2 p p 3 3 p 3 r 0 0.13 0.50 1.00 1.50 1.87 2 4 4 p 5 p 6 6 p 0 1 2 7 p 11 p 6 6 5 p 7 p 4 4 4 p 5 p 3 p 3 3 2 Text Example cont. Solution Now we are ready to graphr= 1 - cos . Because the period of the cosine function is 2r, we need not consider values of beyond 2p. Recall that we discovered the graph of the equationr= 1 - cos has symmetry with respect to the polar axis. Because the graph has symmetry, we may be able to obtain a complete graph without plotting points generated by values of from 0 to 2p. Let's start by finding the values ofrfor values of from 0 to p. p The values forrand are in the table. Examine the graph. Keep in mind that the graph must be symmetric with respect to the polar axis.
p p 2 2 p p 3 3 p 3 4 4 p 5 p 6 6 p 0 1 2 7 p 11 p 6 6 5 p 7 p 4 4 4 p 5 p 3 p 3 3 2 Text Example cont. Solution Thus, if we reflect the graph from the last slide about the polar axis, we will obtain a complete graph of r = 1 - cos , shown below.
p p p p 2 2 2 2 p p p p 0 0 0 0 3p 3p 3p 3p 2 2 2 2 Limacons The graphs of r=a+b sin , r=a-b sin , r=a+b cos , r=a-b cos , a > 0, b > 0 are called limacons. The ratio ab determines a limacon's shape. Inner loop if ab < 1 Heart shaped if ab= 1 Dimpled with no inner No dimple and no inner and called cardiods loop if 1< ab < 2 loop if ab 2.
Example • Graph the polar equation y= 2+3cos
Example • Graph the polar equation y= 2+3cos Solution:
p p p p 2 2 2 2 n = 4 a a n = 3 p p p p 0 0 0 0 a a n = 2 n = 5 3p 3p 3p 3p a 2 2 2 2 Rose Curves The graphs of r=a sin n and r=a cos n, a does not equal 0, are called rose curves. If n is even, the rose has 2n petals. If n is odd, the rose has n petals. r=a sin 2r=a cos 3r=a cos 4r=a sin 5 Rose curve Rose curve Rose curve Rose curve with 4 petals with 3 petals with 8 petals with 5 petals
Example • Graph the polar equation y=3sin2
Example • Graph the polar equation y=3sin2 Solution:
Lemniscates • The graphs of r2 = a2 sin 2 and r2 = a2 cos 2 are called lemniscates Lemniscate: r2 = a2 cos 2