Download
1 / 15
160 likes | 282 Views
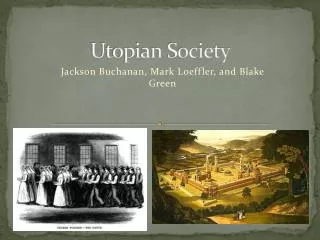
My Utopian Home. By: Lynray Barends, Zola Mahlaza & Grace J egede. Visualisation Motivation. P eople move to highly urbanized areas for employment/studies/relaxation B ut struggle to find good accommodation We are proposing a visualized way of finding accommodation.

E N D
My Utopian Home By: Lynray Barends, Zola Mahlaza & Grace Jegede
Visualisation Motivation • People move to highly urbanized areas for employment/studies/relaxation • But struggle to find good accommodation • We are proposing a visualized way of finding accommodation
What people consider: • Affordable • Safe • close to their work or study place
Related Works 1. Property24 • List formatted data • Not relative to a workplace 2. Gumtree • List formatted • Site has many other features • No map provided
Related Works 3. www.spaceage.co.za: Data analysis - South African crime stats by VusiNkomo • http://goo.gl/MY3bxX • Crime statistics on a provincial level • Not linked to finding accommodation
Important factors: • Affordability - Price • Safety - crime rate • Distance to work place/school - Proximity to X
Prototype 1 1.1 Price and Distance Visual Queries Which apartments are within a 2km radius from place x? Which of the apartments is the cheapest? Where is place x on the map?
Prototype 1 1.2 Bar graph Visual Queries Which apartments are within a 2km radius from place x? Which of the apartments is the cheapest? Where is place x on the map?
Prototype 1 1.3 Safety Visual Queries Which apartments are within a 2km radius from place x? How safe is the area where I will be living? Where is place x on the map?
Prototype 2 1.1 Dart Board Visual Queries Which apartments are within a 2km radius from place x? Which of the apartments is the cheapest? How safe is the area where I will be living?
Prototype 2 1.2 Colour Visual Queries Which apartments are within a 2km radius from place x? Which of the apartments is the cheapest? How safe is the area where I will be living?
Prototype 1 Analysis Map to show relative positions Bar graph to easily compare price ‘heights’ Colourover textures for crime rate of whole areas(avoid clash with map ‘texture’)
Prototype 2 Analysis • Using colours green, yellow, red for increasing crime rates • Distance represented by radius x km • Occlusion, 2.d, colour intensities for ‘closeness’
Data Sources • Map :Google Maps • Prices: Property24 • Distance: user input • Crime: www.crimestats.com • Crime: Western cape government site • find more on: www.inavigate.com
Design 1: Final Design 2: Final Thank you!