Download
1 / 20
250 likes | 636 Views
The Link Between Supply Chain and Financial Performance. From: D’Avanzo, von Lewinski, and Van Wassenhove, SCMR , 2003. Objectives of Study. Determine impact of SC on financial performance Identify the “drivers” of financial performance Identify the capabilities that lead to SC leadership

E N D
The Link Between Supply Chain and Financial Performance From: D’Avanzo, von Lewinski, and Van Wassenhove, SCMR, 2003
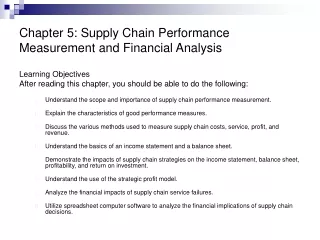
Objectives of Study • Determine impact of SC on financial performance • Identify the “drivers” of financial performance • Identify the capabilities that lead to SC leadership • Ascertain how companies achieve SC excellence
Study Methodology • Statistical analysis of publicly available data on 636 Global 3,000 companies covering 24 industries • Consultation with industry analysts, academic experts, and Accenture execs • In-depth interviews with > 75 executives from 60 companies • Survey of 100 leading executives in North America and Europe
Key Finding #1 Senior executives at leading companies view supply chains as critical drivers of shareholder value and competitive differentiation.
SC Performance & Financial Success • Classified 636 firms based on SC performance on three measures over two time periods • Inventory turns • COGS as percentage of revenue • Return on assets
Classifications of SC Performers • Superior performance = top third for at least 2 of the 3 performance metrics • Leaders – superior SC performance across both time periods • Transformers – SC performance improved to superior range over time • Decliners – SC performance deteriorated from superior range to below it • Laggards – superior SC performance was not achieved in either time period
Cross-Tabulation of SC and Financial Performance • Developed similar classification of financial performance • Based on better-than-average CAGR (compound average growth rate) of market capitalization within an industry • Ran a cross-tab to determine relationship between SC and financial performance
Leaders SC Transformers Category Decliners Laggards Upper Percentage = Lower Percentage = 1% 7% 1% 9% (5%) (5%) (4%) (4%) 2% 2% 3% 3% (2%) (2%) (2%) (2%) 3% 5% 1% 2% (3%) (3%) (2%) (2%) 22% 13% 19% 9% (17%) (16%) (15%) (14%) Actual percent of respondents Percent that would result from random distribution (i.e., no relationship) Financial CategoryLaggards Decliners Transformers Leaders
Result: Strong Relationship • Same categorization on both performance measures found (main diagonal) • Companies in any particular SC category are most likely to be classified in the corresponding financial category (across row) • Chi-Square (p<0.0001) shows relationship is statistically significant
Market Capitalization Growth by SC Performance Category • SC leaders showed market capitalization CAGR between 7 and 26 percentage points higher than industry average growth rate. • SC transformers’ market cap. CAGR increased by 8 percentage points over time • SC decliners showed average drop of 25 percentage points • SC laggards trailed industry average by 2 to 5 points
Key Finding #2 Leading companies incorporate supply chains into their business strategies and devote significant attention to designing integrated operating models.
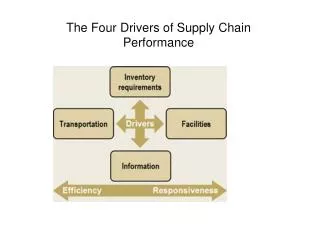
How do the most successful companies leverage their supply chains? • Financial Performance Drivers • Reducing cost: about 65% cite as most important • Enhancing revenue: about 25% cite as most important • Reducing working capital: about 10% cite as most important
Operational Performance Drivers • Reducing SC cost – #1 by about 38% • Improving speed and efficiency – 29% • Improving service quality – 18% • Product innovation – 5% • Expanding channels and markets – 5% • Improving product quality – 4% • Service innovation – 1%
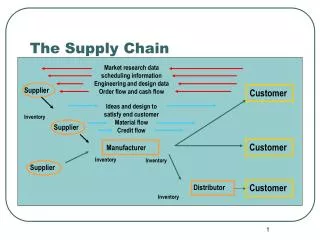
SC Planning Linkages w/customers Linkages w/suppliers Outbound transport. and fulfillment Procurement and sourcing Inbound transport. and fulfillment Linkages to channels and other partners Manufacturing New product design Post-sales service management, warranty, and returns Key Opportunity Areas (in descending order of importance)
Winning SC Strategies • Integrated operating models based on world-class business practices in: • Customer relations • Supplier management • New product design • Core logistics operations
Key Finding #3 Leading supply chain companies build innovation into their operating models, with particular regard to outsourcing, internal/external integration, and matching supply and demand.
Capabilities that foster innovation and supply chain leadership • Matching supply and demand via: • Ultra-high-frequency deliveries • Dynamic pricing coupled with customized assembly • Collaborative forecasting & inventory mgmt. • Next generation efficiency gainsi.e., on leading edge of strategy and technology • Organizational integration both internal and external
Key Finding #4 Leading supply chain companies rigorously execute against their strategies and capabilities, and they constantly adapt them to changing market needs.
Doing the basics well • Drive end-to-end process excellence across the operating model. • Foster process-oriented, collaborative cultures within and across organizations. • Develop corporate-wide, high-level metrics.
Implications and Insights for Decision Makers Three SCM strategies common to most business leaders: • Relentlessly shorten the overall SC to reduce costs and enhance profits. • Flawlessly execute SC capabilities internally and with partners. • Continuously evolve strategies and operating models in anticipation of new market conditions.