Download
1 / 22
280 likes | 658 Views
Overview of Biomass Mapping. Alessandro Baccini, Wayne Walker a nd Ned Horning. The Woods Hole Research Center. November 8 – 12, Samarinda , Indonesia. Large Area Biomass Estimation. Forest Inventories Stratify & Multiply (SM) Approach

E N D
Overview of Biomass Mapping Alessandro Baccini, Wayne Walker and Ned Horning The Woods Hole Research Center November 8 – 12, Samarinda, Indonesia
Large Area Biomass Estimation • Forest Inventories • Stratify & Multiply (SM) Approach • Assign an average biomass value to land cover /vegetation type map • Combine & Assign (CA) Approach • Extension of SM, with GIS and multi-layer information / weightings (Gibbs et al. 2007) • Direct Remote Sensing (DR) Approach • Empirical Models where RS data is calibrated to field estimates (Baccini et al. 2004, Blackard et al. 2008 Baccini et al. 2008) Goetz et al. 2009
Inputs and Model Flow Extract Training for Biomass Sites • Surface Reflectance (NBAR) • View-angle corrected surface reflectance • Pixel mosaic of best quality NBAR • 7 land bands + derived metrics • Biomass training set Estimate Tree Model Apply Model to Regional Data Biomass Map
Available Forest Inventory Data • Only few countries/regions have updated forest inventory data • Measurements are not consistent (D.B.H, species sampled, design) • Spatial distribution non optimal for remote sensing integration and scaling up MODIS 500 m grid over Landsat data and FAO field transects (white lines)
Remote Sensing – Biomass Calibration MODIS pixel Average Value Biomass Value 500 m • Field data measurements • LiDAR observations 500 m
Vegetation structure from Lidar (GLAS) Lidar metrics have been extensively used to characterize vegetation structure (Sun et al. 2008, Lefsky et al. 2005, Lefsky et al. 1999) 70 m Drake et al. (2003), Lefsky et al. 2005, Drake et al. 2002 found a strong relationship between AGB and Lidar metrics (HOME)
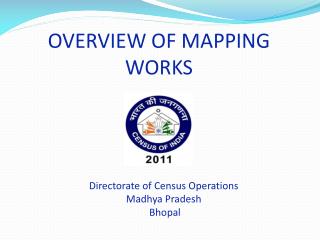
Distribution of forest inventory data in Central AfricaCameroon, Rep of Congo, Uganda Field biomass measurements MODIS 1km NBAR (RGB 2,6,1)
The Geoscience Laser Altimeter System (GLAS) The figure shows 30 % of the GLAS L2A (year 2003) shots after screening procedure. We used 1.3 million observation
Forest Inventory Design for Remote Sensing Calibration and Validation Objective: • A network of new field measurements using a standardized methodology at the sub-national, national and international level • Optimized for remote sensing integration • Predefined locations • Plot size smaller then remote sensing foot print
Scaling to RS Resolution MODIS pixel Average Value Biomass Value 500 m 500 m
Sample Plot Nord • Predefined location • Square shape 40 m by 40 m • Only basic variables recorded East West 40 meters South
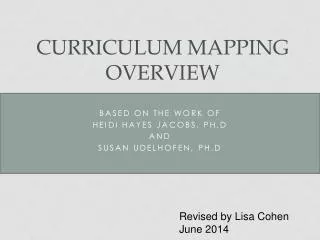
Field Measurements and Data Collection • Tree DBH measurements • All trees with D.B.H > 5 cm • Tree Height • Tallest 3 trees within 25 m • Land cover/Land use Description
Goals • To bring together practitioners in forest biometrics to share information on tools, techniques, and protocols to improve forest inventory designs • To standardize protocols that ensure consistency in measurement acquisition and statistical soundness in sampling design • To collect field data to help • validate and improve above- • ground biomass estimates • throughout the area