Download

1 / 9
100 likes | 393 Views
Bode Diagram (2). Hany Ferdinando Dept. of Electrical Engineering Petra Christian University. General Overview. This section discusses the relationship between system type and the log-magnitude curve

E N D
Bode Diagram (2) Hany Ferdinando Dept. of Electrical Engineering Petra Christian University
General Overview • This section discusses the relationship between system type and the log-magnitude curve • How to determine the static position, static velocity and static acceleration error constants • Bode in Matlab is also explained
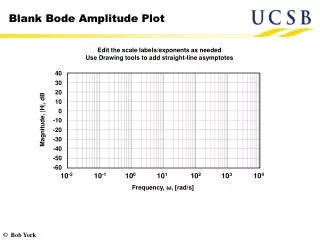
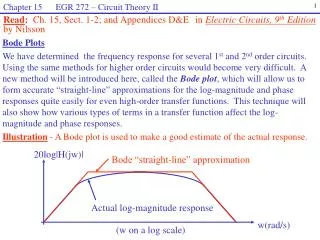
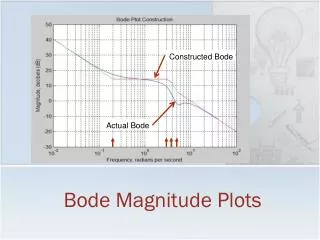
System type & Log-magnitude • The type of the system determines the slope of the log-magnitude curve at low freq. • The information of the existence and magnitude of the steady-state error of a control system to a given input can be determined from the observation of the low freq. region of log-magnitude curve
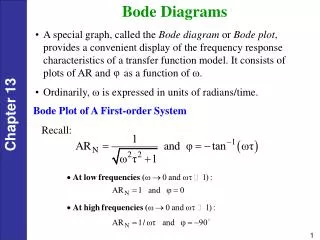
System type N • Type 0 has static position error constants • Type 1 has static velocity error constants • Type 2 has static acceleration error constants System type N is defined as the following G(s)
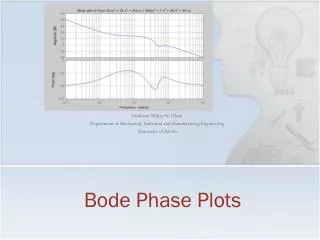
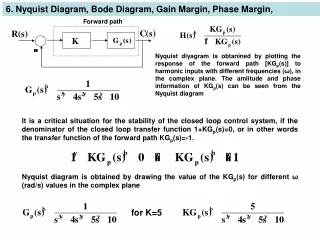
Bode diagram in Matlab Function [mag,phase,w] = bode(num,den) is used to plot Bode diagram in Matlab. The num and den are numerator and denominator of the G(s) respectively. One also uses function [mag,phase,w] = bode(A,B,C,D). This function directly plots both log-magnitude and phase. The log-magnitude is on the upper side of the diagram.
Next… The Bode diagram has been discussed here, the next topic is Phase and Gain Margin. Several important points will be discussed as well Please prepare yourself by reading the book!