Download
1 / 7
70 likes | 190 Views
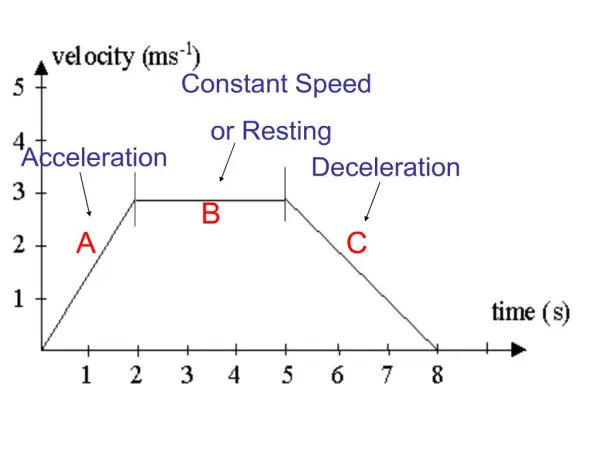
Velocity and Acceleration Graphing Activity. *Note: In this activity, X means position or change in displacement!!! (meters) v = velocity (m/s), and t = time (s) All calculated acceleration values will be in units of m/s 2. 1.) X = 3(t-2) 2 + 3 from t= 1 to t= 3

E N D
Velocity and Acceleration Graphing Activity *Note: In this activity, X means position or change in displacement!!! (meters) v = velocity (m/s), and t = time (s) All calculated acceleration values will be in units of m/s2
1.) X = 3(t-2)2 + 3 from t= 1 to t= 3 • A.) Sketch the graph. What units are X? What units are t? • B.) Label the t values which have the greatest positive and negative slope. • C.) Calculate the slope at each—with the correct units!!! • D.) Explain what is happening at the two points you mentioned in B. • E.) Is there any time(s) where the slope is 0? Where is it? What is happening here?
2.) v = 3*cos(t) from t = -180 to t = +180 MAKE SURE YOUR CALCULATOR IS IN DEGREES! • A.) Sketch the graph. What units are v? What units are t? • B.) Label the t values which have the greatest positive and negative slope. • C.) Calculate the slope at each—with the correct units!!! • D.) Explain what is happening at the two points you mentioned in B. • E.) Is there any time(s) where the slope is 0? Where is it? What is happening here?
3.) v = 7*sin(t) from t = 0 to t = +180 MAKE SURE YOUR CALCULATOR IS IN DEGREES! • A.) Sketch the graph. What units are v? What units are t? • B.) Label the t values which have the greatest positive and negative slope. • C.) Calculate the slope at each—with the correct units!!! • D.) Explain what is happening at the two points you mentioned in B. • E.) Give a brief synopsis of the movement that the whole graph symbolizes.
4.) v = 5*t from t = 0 to t = +10 • A.) Sketch the graph. What units are v? What units are t? • B.) What is the slope in this situation (with the correct unit)? Does the slope change? • C.) Your friend tells you that this person is running at a constant velocity. Do you agree? Why or why not? • D.) Your friend tells you that this person is running at a constant acceleration. Do you agree? Why or why not?
5.) v = 8 from t = 0 to t = +10 • A.) Sketch the graph. • B.) Explain what is happening in this situation.
6.) X = 9 from t = 0 to t = +10 • A.) Sketch the graph. • B.) Explain what is happening in this situation.