Download
1 / 21
210 likes | 311 Views
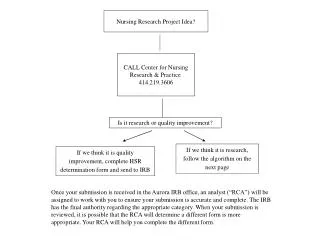
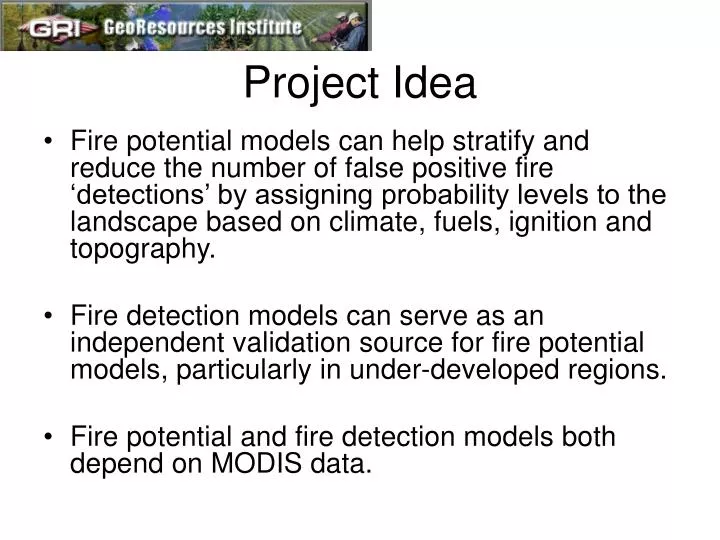
Project Idea. Fire potential models can help stratify and reduce the number of false positive fire ‘detections’ by assigning probability levels to the landscape based on climate, fuels, ignition and topography.

E N D
Project Idea • Fire potential models can help stratify and reduce the number of false positive fire ‘detections’ by assigning probability levels to the landscape based on climate, fuels, ignition and topography. • Fire detection models can serve as an independent validation source for fire potential models, particularly in under-developed regions. • Fire potential and fire detection models both depend on MODIS data.
Existing eastern fire potential models Standardization issues AVHRR/MODIS/VIIRS Existing fire detection systems SERVIR RSAC Testing VIIRS FRANKE, Jonas & Gunter MENZ Remote Sensing Research Group (RSRG) Department of Geography, University of Bonn Bonn, Germany jonasfranke@freenet.de
Existing fire detection systems SERVIR RSAC Giglio, et al. / Remote Sensing of Environment 87 (2003) 273-282 ‘Contextual Fire Detection Algorithm for MODIS’ Absolute Threshold Test T4 > 360 K (320 K at night) Brightness threshold MODIS 4um (T4) (Bands 21 and 22 [1km]) No VIIRS exact replacement Brightness threshold MODIS 11um (T11) (Band 31 [1km]) Two VIIRS bands (M15 [742m], I-5 [371m]) Testing VIIRS
t * 0.8
Inland Evaporation 0 Coastal Evaporation 0 Evaporation Regression ModelsAccepted: Southeastern Geographer
Precipitation – Evaporation (P-Et) Cumulative Inland January December Stoneville, MS Cumulative P-E (average over 40 years) and 2000 estimates Cumulative summaries - Starting date January 1st each year
January December Fairhope, AL Cumulative P-E (40 years average) and 1995 estimates Cumulative summaries - starting date January 1st each year Precipitation – Evaporation (P-Et) Cumulative Coastal
Fire Risk Very Low Low Med High Very High Road Density/Gravity and Fire Ignition
Gravity vs. Road Density Conclusions: Gravity models yield improved estimates of risk at very low levels Road density yields improved estimates of risk at medium levels
18-year Historic AVHRR NDVI 7-day Composites Departure from average greeness
Correlation Results – NDVI and Average Acre Burned • NDVI and fire data averaged by month for each physiographic region • N = 12
Correlation Results – NDVI and Average Acre Burned • NDVI and fire data averaged by year and month for each physiographic region • N = 177
June 1 Terra June 2 Aqua June 3 Terra June 4 Aqua June 6 Aqua June 7 Aqua June 5 Aqua June 8 Terra
VIIRS Simulation • ITD and Chuck O’hara • Florida and Georgia 2007 for tests • Methods transferrable to Central America?
MODIS VIIRS MODIS VIIRS l l l l Band # Band ID Band # Band ID 1 620 - 670 600 - 680 I-1 3.610 Ğ 3.790 M-12 20 3.660 - 3.840 2 841 - 876 845 - 885 I-2 3.550 Ğ 3.930 I-4 3 459 - 479 21 3.929 - 3.989 4 545 - 565 22 3.940 Ğ 4.001 5 1230 - 1250 1230 - 1250 M-8 23 4.020 - 4.080 3.973 Ğ 4.128 M-13 1580 - 1670 M-10 24 4.433 Ğ 4.498 6 1628 - 1652 1580 - 1610 I-3 25 4.482 Ğ 4.549 7 2105 - 2155 2225 Ğ 2275 M-11 26 1.360 - 1.390 M-9 8 405 - 420 402-422 M-1 27 6.535 - 6.895 9 438 - 448 436-454 M-2 28 7.175 - 7.475 10 483 - 493 478-498 M-3 29 8.400 - 8.700 8.400 Ğ 8.700 M-14 11 526 - 536 30 9.580 - 9.880 12 546 - 556 545-565 M-4 10.263 Ğ 11.263 M-15 31 10.780 - 11.280 13 662 - 672 662-682 M-5 10.050 - 12.400 I-5 14 673 - 683 32 11.770 - 12.270 11.538 Ğ 12.488 M-16 15 743 - 753 739-754 M-6 33 13.185 - 13.485 16 862 - 877 846-885 M-7 34 13.485 - 13.785 17 890 - 920 35 13.785 - 14.085 18 931 - 941 36 14.085 - 14.385 19 915 - 965 MODIS Bands 1& 2 are 250 m at nadir VIIRS Bands I-1 & I-2 are 371 m at nadir MODIS Bands 3-7 are 500 m at nadir VIIRS Band I-3 is 371 m at nadir MODIS Bands 8-36 are 1,000 m at nadir VIIRS Bands I-4 & I-5 are 371 m at nadir Comparison of MODIS & VIIRS Bands
VIIRS Vis/NIR BandsFire detection, spatial resolution SNR values are as specified for un-aggregated pixel. At nadir SNR will be ~ better after aggregation. (Predicted are better still)
VIIRS S/MW & LW IR BandsFire detection, spatial resolution SNR values are as specified for un-aggregated pixel. At nadir SNR will be ~ better after aggregation. (Predicted are better still)