Download
1 / 99
1.01k likes | 1.31k Views
Kinematics. Physics of Motion. kinematics. Kinematics is the science of describing the motion of objects using words, diagrams, numbers, graphs, and equations. Speed. How fast something moves Distance/time Miles PER hour Meters PER second. Fast Thinking.

E N D
Kinematics Physics of Motion
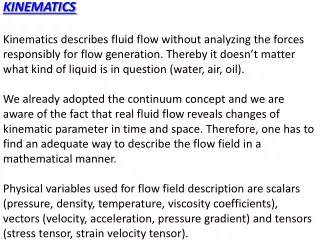
kinematics • Kinematics is the science of describing the motion of objects using words, diagrams, numbers, graphs, and equations.
Speed • How fast something moves • Distance/time • Miles PER hour • Meters PER second
Fast Thinking • 1. Which of the following represents a speed? • a. 6 m • b. 4 hr/km sec • c. 2 m/sec2 • d. 8 m/sec
Velocity • Speed plus a direction • Example: 10 m/s heading north east • 4 m/s heading vertically
Vector Quantities • Properties that have magnitude (size) and direction • Example: velocity
Scalar quantities • Properties that only have magnitude • Examples: • Speed • Temperature
definitions • 1. A ________________ quantity is completely described by its magnitude. • 2. A _________________ quantity has both magnitude and direction. • 3. The velocity of an object at any given instant in time is known as the _________________ velocity. • 4. The rate at which the velocity changes is known as the __________________.
Acceleration • Rate of change of velocity • Vector • Can be + or – • Speeding up or slowing down • Slowing is – acceleration or deceleration • (celer = latin for speed) • m/s/s meters per second per second (m/s2)
Acceleration due to gravity (g) • g = 9.8m/s/s • You can round it up to 10 m/s/s • In freefall, every second you are travelling 10m/s more than the previous second
On your marks…get set…go! • 2. Which of the following represents an acceleration? • a. 16 m2/sec2 • b. 4 hr/km sec • c. 8 km/hr • d. 2 m/s2
Displacement • Defined as NET distance traveled. • (you can walk to school 3miles, walk home 3miles…you have traveled 6 miles, but your displacement is zero • Vector • Compare to “distance” a scalar quantity
I WALK THE LINE… A . Johnny Cash walks 150 meters due east and then turns around and walks 30 meters due west. • He walked a distance of • a. 30 meters • b.150 meters • c. 120 meters • d. 180 meters
B. • 4. Johnny’s displacement is • a. 30 meters east • b.150 meters east • c. 120 meters east • d. 180 meters west
The velocity of this car is constantly changing direction… Therefore it is continually accelerating
The distance between dots on a ticker tape represents the object's position change during that time interval. A large distance between dots indicates that the object was moving fast during that time interval. A small distance between dots means the object was moving slow during that time interval.
For the following tickertapes • Describe the motion occuring
Vector diagrams • Arrows represent direction and magnitude of velocity
Using graphs to describe motion • Position / time graph • The Meaning of Shape for a p-t Graph • Look at the following graphs…
Now consider a car moving with a rightward (+), changing velocity - that is, a car that is moving rightward but speeding up or accelerating.
Positive Velocity Changing Velocity (acceleration)
Constant Velocity Positive Velocity
The Importance of Slope • the slope of the line on a position-time graph reveals useful information about the velocity of the object. • If the velocity is constant, then the slope is constant (i.e., a straight line). If the velocity is changing, then the slope is changing (i.e., a curved line). If the velocity is positive, then the slope is positive (i.e., moving upwards and to the right).
Slow, Rightward (+) Constant Velocity Fast, Rightward (+) Constant Velocity
Slow, Leftward (-) Constant Velocity Fast, Leftward (-) Constant Velocity
If the slope is changing (curve) • Then velocity is changing • Therefore the object is accelerating • Slope going up? = moving right • Going down? = moving left
Leftward (-) Velocity; Slow to Fast Leftward (-) Velocity Fast to Slow
A. The object has a positive or rightward velocity (note the + slope). The object has a changing velocity (note the changing slope); it is accelerating. The object is moving from slow to fast (since the slope changes from small big). B.The object has a negative or leftward velocity (note the - slope). The object has a changing velocity (note the changing slope); it has an acceleration. The object is moving from slow to fast (since the slope changes from small to big).
Meaning of Slope on a position-time graph consider a car moving at a constant velocity of +5 m/s for 5 seconds, abruptly stopping, and then remaining at rest (v = 0 m/s) for 5 seconds.
the slope of the line on a position-time graph is equal to the velocity of the object. • If the object is moving with a velocity of +4 m/s, then the slope of the line will be +4 m/s. If the object is moving with a velocity of -8 m/s, then the slope of the line will be -8 m/s. If the object has a velocity of 0 m/s, then the slope of the line will be 0 m/s.
How to calculate slope • Slope = rise/run • Pick two points on the line and determine their coordinates. • Determine the difference in y-coordinates of these two points (rise). • Determine the difference in x-coordinates for these two points (run). • Divide the difference in y-coordinates by the difference in x-coordinates (rise/run or slope).
Slope = -3.0 m/s • Using the two given data points, the rise can be calculated as -24.0 m (the - sign indicates a drop). The run can be calculated as 8.0 seconds. Thus, the slope is -3.0 m/s.
The Meaning of Shape for a velocity-time Graph Consider a car moving with a constant, rightward (+) velocity of +10 m/s. a car moving with a constant velocity is a car with zero acceleration.