Download

1 / 52
530 likes | 808 Views
A confusion of units! Beaufort Forces Knots (Nautical Miles per hour) Miles per hour Kilometres per hour Metres per second. Measuring Wind. Windy or Calm? Admiral Francis Beaufort. Born in Navan Hydrographer to the Royal Navy Devised one of the first wind scales, from Force 0 to Force 12.

E N D
A confusion of units! Beaufort Forces Knots (Nautical Miles per hour) Miles per hour Kilometres per hour Metres per second Measuring Wind
Windy or Calm?Admiral Francis Beaufort • Born in Navan • Hydrographer to the Royal Navy • Devised one of the first wind scales, from Force 0 to Force 12
Measured at 10m above the ground (Always be aware that Malin Head is much higher. Treat wind readings from oil platforms, ships etc with caution). Mean Speed – average over a ten-minute period Gust Speed – highest instantaneous wind speed Gusts normally do the damage!! Fundamentals of Wind
Wind speed mentioned in marine observations, forecasts, and warnings is the average speed over a 10 minute interval. Wind gusts may be up to 70% higher than the average wind speed. For example, if the average wind speed is 25 knots, occasional gusts up to 40 knots can be expected, depending on stability of the air-mass. Wind Speed and Gusts
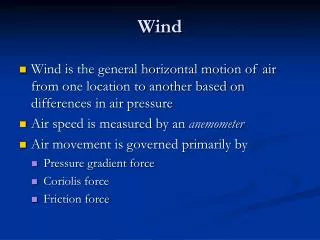
Speed: 1knot = 0. 514 m/s = 1. 15 mph Direction: Direction fromwhich wind blows measured clockwise from true North A veer is a clockwise change A back is an anticlockwise change Mean speed is average over 10 minute period Gusts and lulls are rapid fluctuations due to obstacles and instability which are called turbulence Surface wind Speed Time
Weather systems in the northern hemisphere generally move from west to east due to the earth’s rotation. Movement of tropical systems such as hurricanes are more variable. In the northern hemisphere, winds blow anti-clockwise around lows such as depressions, and clockwise around highs. When the isobars (lines of equal pressure) become more closely spaced, then winds increase. That is, the closer the isobars over a particular area, the higher the wind speed. Surface Weather Systems
A typical weather chart This is the chart for Monday
Typically the wind speed at 2000 feet / 600m Assume air parcel moves from rest P is pressure gradient force Co is Coriolis = 2 Ω SinΦ Co acts at right angles Geostrophic wind Low P 1000 1004 Co 1008 High
Balance when P=Co, ie equal and opposite Vg is the Geostrophic wind Blows parallel to isobars in free atmosphere Forecasters measure Vg from scale Vg=1/Cograd P Balanced Geostrophic flow Low P 1000 Vg 1004 1008 Co High
Surface wind flow Low P 1004 • Note Vg=Vgr • Near ground friction(F) reduces wind speed • Co must reduce • Balance upset • Vectors realign so that P+Co=F • V-the real wind is reduced and blows towards low pressure V Vg 1008 F Co 1012 High
Surface wind flow • Over the Sea V=2/3 Vgr, and is backed approximately 15 degrees to the isobars(depending on stability) • Over the Land V =1/2 Vgr and is backed as much as 40 degrees to the isobars(depending on roughness of ground and stability) L 15 0 H L 40 0 H
Cyclonic curved flow • Ce is centrifugal force due to circular motion • Co must reduce to maintain balance • Vg must reduce to Vgr which is the gradient wind • Forecasters make correction for curvature to get Vgr • Example eye of a storm Low P Vg Vgr Ce Co High
Anticyclonic curved flow Low • Ce acts in unison with P • Co must increase to maintain balance • Vg must increase to Vgr • Forecaster makes correction for radius of curvature to get Vgr • Example periphery of a winter High P Ce Vg Co Vgr High
Another complication ! • A difference between curvature of isobars and trajectories occurs when systems in motion • Strongest winds on south flank of east’wards moving depression • Strongest winds on north flank of westwards moving depression • Similar for mobile anticyclones L L
Heating modifies isobars Trough near lee side of island Veering of wind on exposed side Backing on lee side Strengthening on high pressure side Slackening on low pressure side Thermal wind effects 1000 • 1001 -1 -2 Low • 1002 1003 1004 High
Pre-existing wind Modifying or thermal wind Resultant wind Thermal wind effects
Pressure and drawing of Isobars High • Plotted values are reduced to MSL • Isobars join areas of equal pressure and are drawn with low pressure on their left (Buy’s Ballots Law) • On large Atlantic charts-4hPa intervals • On hourly charts –1 hPa intervals • A pascal =1 Pa = 1N/m2 • A hecto Pascal = 100 Pa = 10 N /m2 • 100Pa = 1mb = 1 hPa X 1005 X 1002 X 997 Low X 999 X 998 x1002 X 1008 X 1008 X 1013
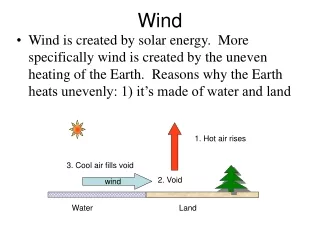
An onshore breeze which develops in coastal areas on a warm day. Differential heating between the land and sea. The Sea Breeze
Sea breeze formation Two columns of air At dawn:
Sea breeze formation As land heats up a circulation develops
Land temperatures need to be at least 3.5 oC warmer than sea temperatures … They are very common and strong in tropical regions In Ireland generally from March to late September. How… and When?
Another thermally driven circulation. Sea warmer than land at night. Usually weaker than the sea breeze. Very rarely exceeds 10 kt. Landbreeze
Sea breezes can occasionally penetrate over 50km inland Sea breezes can enhance convection due to convergence, particularly on peninsulas It’s not just a coastal thing
Offshore wind opposes sea breeze Enhanced convergence Tightening temperature and humidity gradients Seabreeze front
Nice cooling breeze on the coast. Can bring in offshore stratus to spoil a sunny day right on the coast Useful for yachtsmen and inshore fishermen Enhanced convection can lead to some severe weather. Sea Breeze Summary
Modification of broadscale winds Deflection, channelling and shelter Effect on depressions and fronts Lee waves Locally induced winds Katabatic and anabatic winds Valley wind circulations Downslope winds Föhn and Chinook winds Bora wind Mountain Airflow
Factors favouring deflectionover mountain barrier: Long barrier Perpendicular wind flow Concave barrierUnstable air Factors favouring deflection around mountain barrier: Short barrierOblique wind flow Convex barrier Stable air Deflection
Gaps in barrier strengthen wind flowe.g. Mistral (between Alps & Massif Centrale) Channelling
Down-slope wind, usually nocturnal Speed: a few knots Depth: typically ~100 m Best on even, gentle slopes Katabaticwind Cooling
Day-time up-slope wind Speed: 5–10 knots Depth: up to 200 m Best on smooth, hot slopes Anabatic wind Heating
Föhn/ Chinook winds Condensation & release of latent heat Warm Cool
Fog, Drizzle and Rain distinguished by DROP SIZE If droplets are suspended in the air (not falling) then we have FOG or MIST (drop size up to 0.2mm diameter) Falling droplets from 0.2mm to 0.5mm are termed DRIZZLE Drops of greater size constitute RAIN Fog, Rain, Drizzle and Showers
Rain Primarily large geographical scale Origin in dynamical processes Showers Small spatial scale (500m – 20Km) Convective in origin Much higher rates of rainfall Can be embedded in larger scale rain bands Rain and Showers
Fronts Versus Showers Fronts -give widespread rain • Warm • Cold • Occlusion Showers - small Scale • 20km • last 10-20mins • Convective - • develop over warm sea in winter
Forced Ascent Air forced to rise Stratus cloud forms on higher ground Drizzle or rain likely
Convection - creates instability Warm Cooler Cooler Warm air rising Warm air rising Air in contact with high ground is warmer than free air at the same height. Hot Hot
Convection Showersand thunderstorms Warm Cooler Cooler Hot Hot
Orographic Rainfall • There is a clear statistical link between average rainfall and altitude. • The higher the site, the heavier the rainfall. • Mechanisms leading to the increase. • Forced Ascent • Enhanced Convection