Download
1 / 38
380 likes | 388 Views
This article discusses common epilayer defects in thin films and explores the use of rocking curves to investigate these defects. Topics covered include layer and substrate peak splitting, broadening of layer peaks, the effects of sample position, mismatch in thin films, misorientation, dislocations, curvature, and relaxation.

E N D
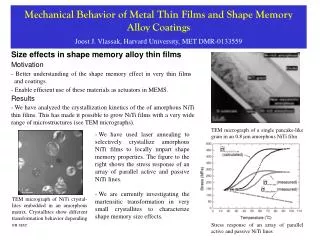
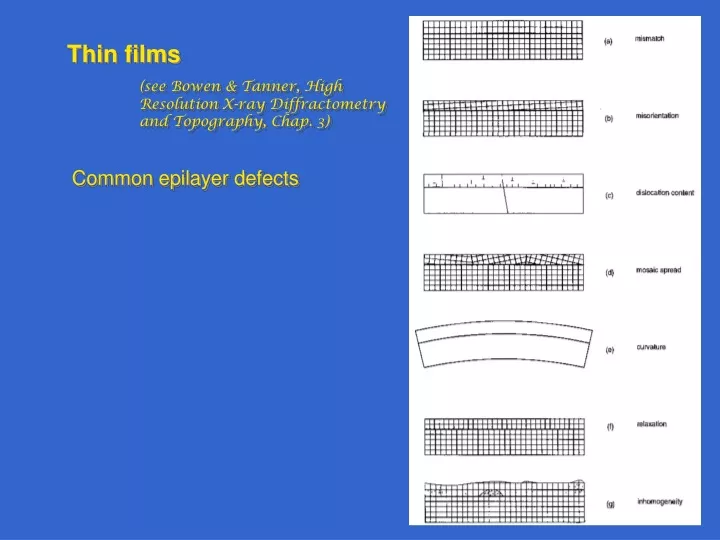
Thin films (see Bowen & Tanner, High Resolution X-ray Diffractometry and Topography, Chap. 3) Common epilayer defects
Thin films (see Bowen & Tanner, High Resolution X-ray Diffractometry and Topography, Chap. 3) Common epilayer defects Investigate using rocking curves
Thin films (see Bowen & Tanner, High Resolution X-ray Diffractometry and Topography, Chap. 3) Common epilayer defects Investigate using rocking curves Layer & substrate peaks split rotation invariant
Thin films Common epilayer defects Investigate using rocking curves Layer & substrate peaks split varies w/rotation
Thin films Common epilayer defects Investigate using rocking curves Broadens layer peak invariant w/ beam size peak position invariant w/ sample position
Thin films Common epilayer defects Investigate using rocking curves Broadens layer peak may increase w/ beam size peak position invariant w/ sample position
Thin films Common epilayer defects Investigate using rocking curves Broadens layer peak increases w/ beam size peak position varies w/ sample position
Thin films Common epilayer defects Investigate using rocking curves Layer & substrate peaks split splitting different for symmetric & asymmetric reflections
Thin films Common epilayer defects Investigate using rocking curves Various effects vary w/ sample position
Thin films Investigate using rocking curves Film thickness Integrated intensity changes increases w/ thickness Interference fringes
Thin films Mismatch constrained relaxed
Thin films Mismatch Layer & substrate peaks split – rotation invariant Measure, say, (004) peak separation , from which d/d = – cot = m* (mismatch) constrained relaxed
= 90° Thin films Misorientation First, determine orientation of substrate rotate to bring plane normal into counter plane do scans at this position and at + 180° orientation angle = 1/2 difference in two angles
shift + = 90° Thin films Misorientation First, determine orientation of substrate Layer tilt (assume small) layer peak shifts w/ in scans
shift – = 90° Thin films Misorientation First, determine orientation of substrate Layer tilt (assume small) layer peak shifts w/ in scans
no shift = 90° Thin films Misorientation First, determine orientation of substrate Layer tilt (assume small) layer peak shifts w/ in scans
no shift = 90° Thin films Misorientation First, determine orientation of substrate Layer tilt (assume small) layer peak shifts w/ in scans
Thin films Dislocations From: high mismatch strain, locally relaxed local plastic deformation due to strain growth dislocations
Thin films Dislocations From: high mismatch strain, locally relaxed local plastic deformation due to strain growth dislocations Estimate dislocation density from broadening (radians) & Burgers vector b (cm): = 2/9b2
Thin films Curvature R = radius of curvature, s = beam diameter angular broadening = s/R = beam radius broadening 5 mm 100 m 10"
Thin films Relaxation Need to measure misfit parallel to interface Both mismatch & misorientation change on relaxation Interplanar spacings change with mismatch distortion & relaxation – changes splittings
Thin films Relaxation Need to measure misfit parallel to interface Both mismatch & misorientation change on relaxation So, also need misfit perpendicular to interface Then, % relaxation is
reflecting plane Thin films Relaxation Grazing incidence Incidence angle usually very low….~1-2° Limits penetration of specimen
Thin films Relaxation Grazing incidence Incidence angle usually very low….~1-2° Limits penetration of specimen Penetration depth –G(x) = fraction of total diffracted intensity from layer x cm thick compared to infinitely thick specimen
Thin films Relaxation Grazing incidence Incidence angle usually very low….~1-2° Limits penetration of specimen Penetration depth –G(x) = fraction of total diffracted intensity from layer x cm thick compared to infinitely thick specimen
reflecting plane Thin films Relaxation Grazing incidence Incidence angle usually very low….~1-2° Reflection not from planes parallel to specimen surface
Thin films Relaxation Grazing incidence If incidence angle ~0.1-5° & intensity measured in symmetric geometry (incident angle = reflected angle), get reflectivity curve
Thin films Relaxation Need to measure misfit parallel to interface Use grazing incidence e.g., (224) or (113)
Thin films Relaxation Use grazing incidence e.g., (224) or (113) Need to separate tilt from true splitting Tilt effect reversed on rotation of = 180° Mismatch splitting unchanged on rotation
Thin films Relaxation Use grazing incidence e.g, (224) or (113) For grazing incidence: i = + – splitting betwn substrate & layer
Thin films Relaxation Use grazing incidence e.g, (224) or (113) For grazing incidence: i = + e = – Can thus get both and
Thin films Relaxation Also, And
Thin films Relaxation Also, And Finally
Thin films Homogeneity Measure any significant parameter over a grid on specimen Ex: compositional variation get composition using Vegards law measure lattice parameter(s) – calculate relaxed mismatch
Thin films Homogeneity Measure any significant parameter over a grid on specimen Ex: variation of In content in InAlAs layer on GaAs
Thin films Thickness For simple structure layer, layer peak integrated intensity increases monotonically w/ thickness calculated curves
Thin films Thickness For simple structure layer, layer peak integrated intensity increases monotonically w/ thickness Note thickness fringes Can use to estimate thickness calculated curves
Thin films Thickness For simple structure layer, layer peak integrated intensity increases monotonically w/ thickness calculated curves