Download
1 / 24
240 likes | 518 Views
What would full employment look like in contemporary Britain? Amna Silim 27 th November 2013. Outline. The new case for full employment The evolution of British employment policy Full employment in the mid 2000s The potential trade-offs with full employment

E N D
What would full employment look like in contemporary Britain? Amna Silim 27th November 2013
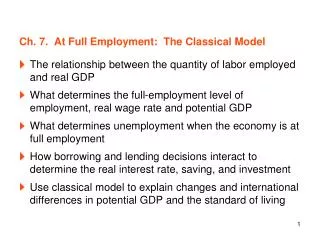
Outline • The new case for full employment • The evolution of British employment policy • Full employment in the mid 2000s • The potential trade-offs with full employment • Elements of a new definition of full employment • Policy directions
The new case for full employment • 80 per cent employment rate – alongside very low unemployment rate • Additional 3.5 million people would need to be in work
The evolution of British employment policy • 1945 to mid-1960s: post-war consensus on full employment / demand management • Late 1960s and 1970s: breakdown of the post-war consensus – rising inflation, oil shocks • 1970s / 1980s: new orthodoxy – low and stable inflation • 1990s / 2000s: inflation focus + employability • Late 2000s: more focus on wider labour supply but rooted in employability
Why full employment? • Labour market inclusion • Family incomes and poverty • Public finances
Benefits of full employment • If higher employment forced up real wages by 2 per cent in 2013/14 (instead of the 1.5 per cent drop predicted by OBR) • In 2013/14 tax credit and benefit spending would be £1.1 billion lower • Income tax and national insurance receipts would increase by £12.5 billion higher
Benefits of full employment Increasing the employment rate from 71.5 per cent to 73 per cent • Net gain to the exchequer of £5.5 billion • Spending on tax credits would fall by £2.4 billion a year • Income tax and national insurance receipts would rise by £3.1 billion
‘Full employment’ in 2006 • Strong employment performance among prime-age men • Employment gaps fell - but significant gaps remained: • People with particular disabilities • Some people from an ethnic minority background • Older women • People with few / none formal qualifications • Parts of the North, Wales, Northern Ireland, London • 4 million+ working-age adults remained on out-of-work benefits
Northern Ireland employment • Northern Ireland 2006 • Female Employment: 61.3 per cent (UK 66.9 per cent) • Male employment rate: 74.3 per cent (79.0 per cent) • Inactivity rate: 27.2 per cent (23.0 per cent) 2013 • Older employment rate: 61.7 per cent (NI average 67.3 per cent) • Youth employment rate: 40.9 per cent (NI average 67.3 per cent)
Inflation • Relationship between inflation and unemployment very weak over the last 20 years • External factors (e.g. commodity prices) have been more important for determining inflation
Productivity • Good evidence for an employment-productivity trade-off • Higher employment rates means more people with relatively low productivity in work, often in low-productivity sectors • But weak productivity growth in domestic sector likely to mean weak wage growth, poor job quality
Key components • Target employment as well as unemployment • Households as well as individuals • Tackle household worklessness • Dual-earner household strategy • Recognise people’s roles as parents, carers and active citizens • Opportunities for learning esp. for young people
Do we need a target? • Technical difficulties over definition • Post-war governments got there without a target • Politicians unlikely to adopt until close to achieving • But need an answer to ‘what do you mean by full employment?’ • Full employment = low unemployment rate and 80% employment rate
Policy directions • Target monetary policy on job creation • Rediscover job creation / labour demand as well as supply / employability • Prioritise social investment in public spending • Stronger employment support and job creation for specific groups • Stronger counter-cyclical options e.g. more focus on job retention in future downturns