Download
1 / 71
710 likes | 921 Views
WatProdGA. decision support model. Improved Crop Production Integrating GIS and Genetic Algorithms. Amor V.M. Ines Doctoral Candidate, Asian Institute of Technology, P.O. Box 4 Klong Luang 12120 Pathumthani, Thailand

E N D
WatProdGA decision support model Improved Crop Production Integrating GIS and Genetic Algorithms Amor V.M. Ines DoctoralCandidate,Asian Institute of Technology, P.O. Box 4 Klong Luang 12120 Pathumthani, Thailand Then Doctoral Fellow, International Water Management Institute, P.O. Box 2075 Colombo, Sri Lanka
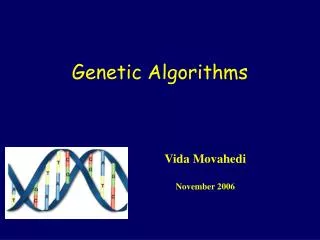
E D C B A F Cities Start/End The Traveling Salesman Problem Mr. Salés Man Ynes
WATER • VITAL FOR LIFE • LIMITED • VULNERABLE
RESOURCES AVAILABLE We can explore options in water management Problems and Opportunities EXTERNAL STIMULI field level Physical properties (soil, water quality, GW depth…) Management practices (water, crop mgt…) Capable of Regional scale application To characterize this complexity in the system System We need a ROBUST model
STATEMENT OF THE PROBLEM • Limitation of field scale agro-hydrological models: spatial constraint • Regional application of agro-hydrological models: • How to effectively derive the spatially attributed data that are not visible from RS observations for the regional analyses? • How to explore the optimal use of water in crop production considering the system’s spatial attributes and the availability of resources. • GENERAL HYPOTHESES • Systems (regional) and systems analysis • The complexities in the system mentioned above can be accounted for by field scale models through a quasi-regional approach wherein the input data are considered as distributed; • The distributed model parameters can be derived from remote sensing observations though the process of data assimilation by exploring the dependency of the observed hydrological processes to the physical and non-physical properties of the system, an inverse modeling approach;
The quasi-regional model can be used to explore options in water management; and • Genetic Algorithms can be used to implement data assimilation and water management optimization. • OBJECTIVES • General: • To develop a methodology that could explore improved water management options at the regional level through systems integration. • Specific: • 1. To develop a methodology that can utilize remote sensing (RS) information as input data to simulation models to quantify systems characteristics. • 2. To develop and validate a Genetic Algorithm (GA) based methodology to optimize water management practices under different environmental conditions. • 3. To apply the developed methodology to regional scale modeling to assess land and water productivity.
SCOPE AND LIMITATIONS • This study confines to the development and application of an integrated methodology to water management in irrigated agriculture by regionalizing a field scale model via the use of advanced spatial information systems (RS and GIS) and an optimization technique based on natural genetics called Genetic Algorithm. • The application and validation of the model are limited only to the tertiary level of a large irrigation system. Only one crop has been considered in the applications, the dominant crop during the growing season under consideration. Wheat (Triticum aestivum) is mostly grown during the rabi season in Northwestern India where the case study was conducted.
Problem Formulation This study has been designed to address two significant points in regional agro-hydrological analysis: • how to derive the spatial data inputs for the regional modeling, and; • how to translate the results into optimal operation rules for regional water management
The Challenge in Regional Agro-hydrology Schematic of a regional analysis. Schematic of a system characterization by exploring the dependency of the measured hydrological data with the system properties.
Optimization of Water Management Strategies Formulation of the Water Management Model: Objective function: Subject to either : (strict constraint) (relaxed constraint)
…Water Management Model Water management variables: Crop management variables:
…Water Management Model Where:
…Water Management Model By definition:
Water Management Optimization Model RS/GIS data Water Management Options General Framework of the Study Regional model System characterization DATA Genetic Algorithm
Genetic Algorithms What are they? GAs are mathematical models of natural genetics What they do? They try to mimic the mechanisms of nature in developing well-fitted species that could survive in the current state of the environment How they do it? By exploring good traits (genes) of an individual that can be transmitted from generation to generation
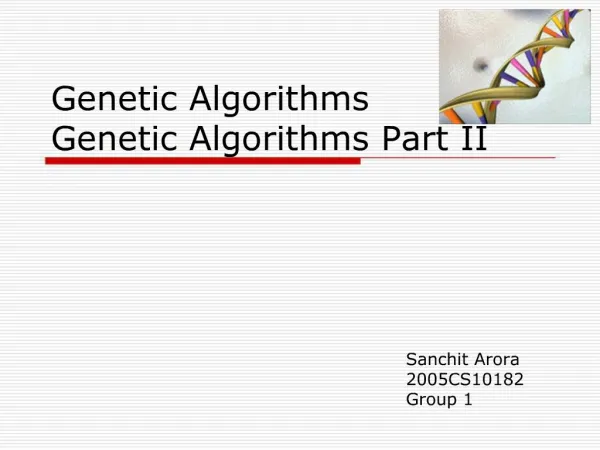
eaten eaten Just married eaten eaten eaten down to hole Survival of the fittest low IQ high jumpers high IQ low jumper low IQ low jumpers gluttons
A1 B5 B1 Selection Reproduction Crossover Mating Pool A5 B1 B5 Mutation . : GA in a nutshell Fitness (Measure) Option1 Option2 A1 B1 : (t+1) Population (t) . An Bn A3
System Characterization Field Scale Lysimeter study GA implementation Regional Scale
N (, ) Distributed Regional Model:The Extended SWAP model Distributed N (, )
System Characterization [x, y] Irrigation dates, depths Spatial distribution yield t+2t t+t ETa water balance Extended SWAP SEBAL By Genetic Algorithm water productivity . . . t t+2t … t+t t+nt Past Time The future
Regional mode SWAP model DATA Genetic Algorithm Water Management Options Development of WatProdGA WatProdGA Decision Support Model
Applications • Quantification of System Characteristics Using Regional Inverse Modeling • Optimization of Water Management Options
STUDY AREA The Study Area After Sakthivadivel et al., 1999 Bhakra Irrigation System, Haryana, India
Snapshot of Kaithal Irrigation Circle (Landsat 7ETM+) Kaithal Sirsa branch Bata minor (inset)
BataMinor offtake Sirsa branch tail
Quantification of System Characteristics Using Regional Inverse Modeling
Option1 Option2 Individual Water mgt. Crop mgt. Unconstrained Form: Penalty Method Penalty function Penalty coefficient
ASD: average sum of the difference Daily data: 4-parameter problem
1st layer 2nd layer (a) 1st layer 2nd layer (b) Simulated soil water compared to the base values using ETa as criterion in (a) daily, 4-parameter problem and (b) weekly, 4-parameter problem.
2nd layer 1st layer (a) 1st layer 2nd layer (b) Simulated soil water compared to the base values using ETa as criterion in (a) daily, 8-parameter problem and (b) weekly, 8-parameter problem
Scatter diagram of the (a) best: (4-parameter, θ + ETa) and (b) worst: (8-parameter, ETa) observed and simulated soil water contents after a GA solution.
SW + ETa SW ETa Simulated and measured soil water using GA derived MVG parameters in the experimental study (4-parameter)
SW SW + ETa ETa Simulated and measured soil water using GA derived MVG parameters in the experimental study (8-parameter)
VALIDATION (1) Measured and simulated actual yield (2) Total actual ET and (3) Total drainage during the lysimeter study (4-parameter problem): Experimental case
(1) Measured and simulated actual yield (2) Total actual ET and (3) Total drainage during the lysimeter study (8-parameter problem): Experimental case
Quantification of System Properties Using Regional Inverse Modeling
February 4, 2001 March 8, 2001 ETa, mm ETa, mm 2.90 2.48 2.06 1.64 1.22 4.20 0.80 3.44 m m 2.68 1.92 1.16 0.40 ETa in Bata Minor from SEBAL analysis
Classification Cropped area Cropped area February 4, 2001 March 8, 2001
GA solution to the regional inverse modeling February 4, 2001 March 8, 2001
System characteristics derived by GA * The mean and standard deviation were derived independently, so the values depended on the range between their prescribed maximum and minimum values. ** Sowing dates were represented by emergence dates in Extended SWAP.
Areal water balance and depth to groundwater from regional inverse modeling.