Download
1 / 46
500 likes | 1.1k Views
Exergy flows in the economy Ayres IIASA 10 August 2007 Cumulative US crude oil production since 1900 Ayres IIASA 10 August 2007 Source: Dave Rutledge, The coal question and climate change : http://www.theoildrum.com 6/20/2007 Oil production since 2002 approaching saturation

E N D
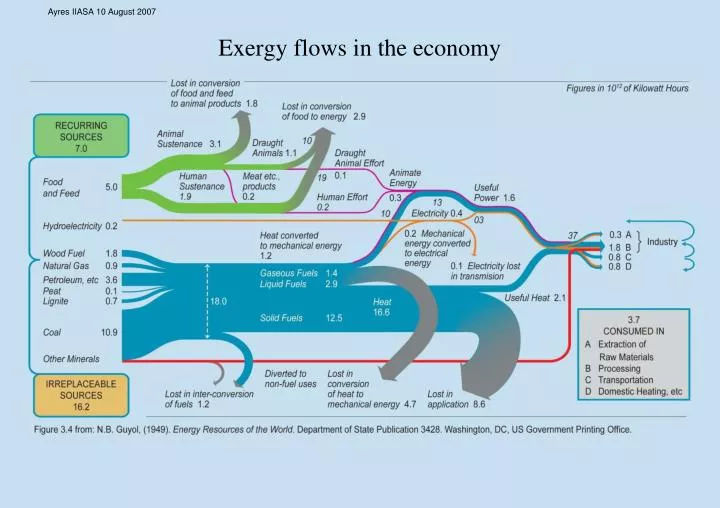
Exergy flows in the economy Ayres IIASA 10 August 2007
Cumulative US crude oil production since 1900 Ayres IIASA 10 August 2007 Source: Dave Rutledge, The coal question and climate change : http://www.theoildrum.com 6/20/2007
Oil production since 2002 approaching saturation Ayres IIASA 10 August 2007 Source: http://www.theoildrum.com
World CO & NGL production projection to 2020 Ayres IIASA 10 August 2007 Source: http://www.theoildrum.com
World oil production projection to 2030 –”Business as usual” scenario Source: http://www.theoildrum.com
World oil production projection to 2030 – Peak oil, bottom up scenario Source: http://www.theoildrum.com
World oil production projection to 2030 – Peak oil, curve fitting Source: http://www.theoildrum.com
World oil production projection to 2040 Ayres IIASA 10 August 2007 Source: http://www.theoildrum.com
Oil production since 2002 approaching saturation Ayres IIASA 10 August 2007 Source: http://www.theoildrum.com
Major Oil-Producing Countries: 1971-2001 Ayres IIASA 10 August 2007 700 United Arab Emirates US Iran (Islamic Republic of) Mexico Former USSR China Canada Norway Saudi Arabia Venezuela 600 500 400 300 200 100 0 1972 1974 1976 1978 1980 1982 1984 1986 1988 1990 1992 1994 1996 1998 2000
Global oil discoveries minus global oil consumption 1965-2003 Ayres IIASA 10 August 2007 50 40 30 20 Gigabarrels annually 10 0 -10 -20 -30 1965 1970 1975 1980 1985 1990 1995 2000 year Source: Heinberg 2004, "Powerdown", Figure 5 page 43 Until well into the 1970s, new global oil discoveries were more than sufficient to offset production each year. Since 1981, the amount of new oil discovered each year has been less than the amount extracted and used.
The wrong kind of shortage Ayres IIASA 10 August 2007 1600 proved and probable reserves proved reserves 1400 1200 1000 Billion barrels 800 600 400 200 0 2004 1980 1984 1988 1992 1996 2000 year Source: Strahan 2007, "The Last Oil Shock", Figure 13 page 71 Global "proved reserves" (wide bars) give the reassuring appearance of continuing growth, but the more relevant "proved and probable reserves" (thin bars) have been falling since the mid-1980s.
History of UK coal production Ayres IIASA 10 August 2007 Source: Dave Rutledge, The coal question and climate change : http://www.theoildrum.com 6/20/2007
History of British Coal Reserves Ayres IIASA 10 August 2007 Source: Dave Rutledge, The coal question and climate change : http://www.theoildrum.com 6/20/2007
History of reserve/production (RP) ratio for British coal Ayres IIASA 10 August 2007 Source: Dave Rutledge, The coal question and climate change : http://www.theoildrum.com 6/20/2007
Cumulative British coal production Ayres IIASA 10 August 2007 Source: Dave Rutledge, The coal question and climate change : http://www.theoildrum.com 6/20/2007
Cumulative US Eastern coal production (excluding anthracite) Ayres IIASA 10 August 2007 Source: Dave Rutledge, The coal question and climate change : http://www.theoildrum.com 6/20/2007
Coal production, China: 1918-2006 Ayres IIASA 10 August 2007 Source: Dave Rutledge, The coal question and climate change : http://www.theoildrum.com 6/20/2007
Coal reserve adjustment Ayres IIASA 10 August 2007 Region Reserves Gt Trends Gt 255 235 North America 190 70 East Asia 79 50 Australia and New Zealand Europe 55 21 Africa 30 10 Former Soviet Union 223 18 111 South Asia 20 Central and South America World (at 3.6 boe/t) 963 (3.5 Tboe) 435 (1.6 Tboe) Note: IPCC assumed 18 Tboe available Source: Dave Rutledge, The coal question and climate change : http://www.theoildrum.com 6/20/2007
Hubbert linearization: World oil & gas output 1960-2006 Ayres IIASA 10 August 2007 Source: Dave Rutledge, The coal question and climate change : http://www.theoildrum.com 6/20/2007
Future fossil fuel extraction, cumulative trends Ayres IIASA 10 August 2007 Source: Dave Rutledge, The coal question and climate change : http://www.theoildrum.com 6/20/2007
Future Temperature Increases Ayres IIASA 10 August 2007 Source: Dave Rutledge, The coal question and climate change : http://www.theoildrum.com 6/20/2007
Future CO2 concentrations Ayres IIASA 10 August 2007 Source: Dave Rutledge, The coal question and climate change : http://www.theoildrum.com 6/20/2007
IPCC scenarios + producer-limited case Ayres IIASA 10 August 2007 Source: Dave Rutledge, The coal question and climate change : http://www.theoildrum.com 6/20/2007
Production-consumption systems Ayres IIASA 10 August 2007 A. CLOSED STATIC PRODUCTION CONSUMPTION SYSTEM Production of Purchases Consumption Goods and of Final Goods Wages, Rents and Services Services B. CLOSED DYNAMIC PRODUCTION CONSUMPTION SYSTEM Production of Consumption Purchases of Final Goods Goods and Wages, Rents and Services Services Purchases of capital goods Invested Savings Capital Capital depreciation C. OPEN STATIC PRODUCTION CONSUMPTION SYSTEM Production of Consumption Purchases of Final Goods Goods and Wages, Rents and Services Services Consumption "Raw" wastes materials Production wastes Waste Extraction Disposal Recycled materials Treatment
Economic production functions: I Ayres IIASA 10 August 2007 Common practice ( ) = Y Q A , H , G L , F R , K t t t t t t t t ( ) ( ) ( ) a b g = Y A H G L F R K t t t t t t t t is output at time given by Q a function of, Y t, t inputs of and K , L , R capital, labor natural • t t t . resource services a g b + = 1, • , + (constant returns to scale assumption) is • A total factor productivity t and coefficients of H , G F factor quality • t t t
GDP and factors of production, US 1900-2005 Ayres IIASA 10 August 2007 Index (1900=1) 50 40 GDP Capital 30 Labor Exergy Useful Work 20 10 0 1900 1910 1920 1930 1940 1950 1960 1970 1980 1990 2000 2010 year
US GDP 1900-200; Actual vs. 3-factor Cobb Douglas function L(0.70), K(0.26), E(0.04) Ayres IIASA 10 August 2007 GDP Index (1900=1) 25 20 US GDP 15 10 SOLOW RESIDUAL (TFP) 5 Cobb-Douglas 1940 1960 1980 2000 1900 1920 year
Technological Progress Function and Solow Residual USA: 1900 - 2005 Ayres IIASA 10 August 2007 Index (1900=1) 5.5 5 4.5 TPF (1.6% per annum) unexplained Solow residual 4 3.5 3 2.5 2 1.5 1 1900 1910 1920 1930 1940 1950 1960 1970 1980 1990 2000 2010 year
Exergy flows in the economy Ayres IIASA 10 August 2007
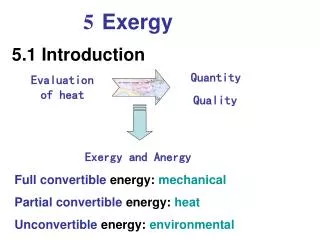
EXERGY TYPES Ayres IIASA 10 August 2007 • 1. FOSSIL FUELS • (Coal, Petroleum, Natural Gas, Nuclear) • 2. BIOMASS • (Wood, Agricultural Products) • 3. OTHER RENEWABLES • (Hydro, Wind) 4. METALS 5. OTHER MINERALS
Cost of power per hour as multiple of hourly wage Ayres IIASA 10 August 2007 10.0 10 kW reciprocating steam 10 kW Otto cycle gas engine 100 kW reciprocating steam 10 hp Otto cycle 1 mW= 1000 kW steam turbine 100 hp Diesel Envelop; mobile prime movers 1.0 Diesel 10 mW steam turbine 1000 hp gas turbine 10000 hp aero gas turbine 100 mW steam turbine 1000 hp Diesel Diesel Envelop; stationary prime movers (electric power) 0.1 aero derivative gas turbine (stationary) 0 1860 1880 1900 1920 1940 1960 1980 2000
Feedback loop (simple Salter cycle) Ayres IIASA 10 August 2007 Lower Unit Prices Increased Consumer Increasing Lower Unit Demand (Price Experience Costs Elasticity) Increased Scale of Production
The first industrial revolution Ayres IIASA 10 August 2007 Coal replaces charcoal in iron-making Price of iron falls Price of coal falls demand for coal grows Iron replaces wood in carts, etc. Invention of steam engine for pumping (Newcomen) production & sales of coal grow Production of iron grows Need for pumping Steam power replaces horses, wind, etc. Deeper mines, flooding Labor productivity grows
Economic production functions: II Ayres IIASA 10 August 2007 The production function can be either CD, or LINEX ì ü æ ö + L U L æ ö æ ö = - + - ç ÷ Y U a ab exp 2 1 ç ÷ ç ÷ í ý ç ÷ K U t è ø è ø è ø î þ For the USA, a = 0.12, b = 3.4 (2.7 for Japan) Corresponds to Y = K L U 0.38 0.08 0.56 At , 'total factor productivity', is REMOVED • • Resources (Energy & Materials) replaced by WORK • Ft = energy-to-work conversion efficiency • Factors ARE MUTUALLY DEPENDENT • Empirical elasticities DO NOT EQUAL COST SHARE
Exergy (E) Austria, Japan, UK & US: 1900-2005 Ayres IIASA 10 August 2007 exajoules 140 120 100 80 USA Japan UK Austria 60 40 20 0 1900 1920 1940 1960 1980 2000
Exergy (E) Austria, Japan, UK & US: 1900-2005 (1900=1) Ayres IIASA 10 August 2007 index 18 USA Japan UK Austria 16 14 12 10 8 6 4 2 0 1900 1920 1940 1960 1980 2000
Useful Work (U) Austria, Japan, UK & US: 1900-2005 Ayres IIASA 10 August 2007 exajoules 18 16 14 12 10 USA Japan UK 8 Austria 6 4 2 0 1900 1920 1940 1960 1980 2000
Useful Work (U) Austria, Japan, UK & US:1900-2005 (1900 = 1) Ayres IIASA 10 August 2007 index 90 80 USA Japan UK Austria 70 60 50 40 30 20 10 0 1900 1920 1940 1960 1980 2000
Aggregate efficiency (U/E) Austria, Japan, UK & US: 1900-2005 Ayres IIASA 10 August 2007 percent 22% 20% USA Japan 18% UK Austria 16% 14% 12% 10% 8% 6% 4% 2% 0% 1900 1920 1940 1960 1980 2000
Empirical and estimated GDP US 1900-2000 excluding 1941-1948 Ayres IIASA 10 August 2007 US GDP (1900=1) 25 GDP estimate LINEX 20 GDP estimate Cobb-Douglas Empirical GDP 15 10 POST-WAR COBB DOUGLAS alpha=0.51 beta=0.34 gamma=0.15 PRE-WAR COBB DOUGLAS alpha=0.37 beta=0.44 gamma=0.19 5 0 1900 1920 1940 1960 1980 2000 year Empirical GDP from Groningen GGDC Total Economy Growth Accounting Database: Marcel P. Timmer, Gerard Ypma and Bart van Ark (2003), IT in the European Union: Driving Productivity Divergence?, GGDC Research Memorandum GD-67 (October 2003), University of Groningen, Appendix Tables, updated June 2005
Empirical and estimated GDP Japan 1900-2000 excluding 1941-1948 Ayres IIASA 10 August 2007 GDP Japan (1900=1) 50 GDP estimate LINEX 40 GDP estimate Cobb-Douglas Empirical GDP 30 20 POST-WAR COBB DOUGLAS alpha=0.78 beta=-0.03 gamma=0.25 PRE-WAR COBB DOUGLAS alpha=0.33 beta=0.31 gamma=0.35 10 0 1900 1920 1940 1960 1980 2000 year Empirical GDP from Groningen GGDC Total Economy Growth Accounting Database: Marcel P. Timmer, Gerard Ypma and Bart van Ark (2003), IT in the European Union: Driving Productivity Divergence?, GGDC Research Memorandum GD-67 (October 2003), University of Groningen, Appendix Tables, updated June 2005
Empirical & estimated GDP, UK 1900-2005 (1900=1) Ayres IIASA 10 August 2007 indexed 1990 Gheary-Khamis $ 7 GDP estimate LINEX 6 GDP estimate Cobb-Douglas 5 Empirical GDP 4 3 COBB DOUGLAS alpha=0.42 beta=0.24 gamma=0.34 2 1 0 1900 1910 1920 1930 1940 1950 1960 1970 1980 1990 2000 2010 year Empirical GDP from Groningen GGDC Total Economy Growth Accounting Database: Marcel P. Timmer, Gerard Ypma and Bart van Ark (2003), IT in the European Union: Driving Productivity Divergence?, GGDC Research Memorandum GD-67 (October 2003), University of Groningen, Appendix Tables, updated June 2005
Empirical & estimated GDP, Austria 1950-2005 (1950=1) Ayres IIASA 10 August 2007 indexed 1990 Gheary-Khamis $ 7 GDP estimate LINEX 6 GDP estimate Cobb-Douglas 5 Empirical GDP 4 3 POST-WAR COBB DOUGLAS alpha=0.56 beta=0.20 gamma=0.24 2 1 0 1900 1910 1920 1930 1940 1950 1960 1970 1980 1990 2000 2010 Empirical GDP from Groningen GGDC Total Economy Growth Accounting Database: Marcel P. Timmer, Gerard Ypma and Bart van Ark (2003), IT in the European Union: Driving Productivity Divergence?, GGDC Research Memorandum GD-67 (October 2003), University of Groningen, Appendix Tables, updated June 2005
REXS model forecast of US GDP 2000-2050 Ayres IIASA 10 August 2007 Simulation results using 45 the plausible trajectories of technical efficiency growth HIGH as a function of cumulative Initial ~3% growth rate, for 130% 33.75 primary exergy production target increase in technical efficiency. 22.5 MID Initial 1.5% growth rate for target 120% improvement in efficiency. 11.25 LOW Shrinking economy at rate of 2 - 2.5% after 2010 if the target 0 technical efficiency is only 115% 1900 1918 1936 1954 1972 1990 2008 2026 2044 year GDP (1900=1) greater than the current. empirical low mid high Source: "The MEET-REXS model". Ayres & Warr 2006