Download

1 / 22
230 likes | 386 Views
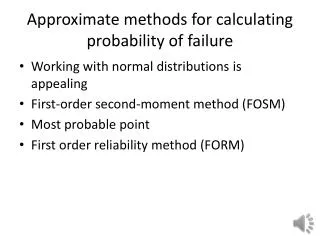
21373 Two methods for calculating approximate pressure losses in pipes. by Bob McNair. Menu. Slow Speed considerations Viscosity Chart Moody Diagram Relative Roughness Reynolds Number Kinematic Viscosity Units of Viscosity Unit conversion Examples. Slow Speed FO System.

E N D
21373Two methods for calculating approximate pressure losses in pipes by Bob McNair
Menu • Slow Speed considerations • Viscosity Chart • Moody Diagram • Relative Roughness • Reynolds Number • Kinematic Viscosity • Units of Viscosity • Unit conversion • Examples
Slow Speed FO System For heavy fuel oil consider the system a Closed Loop system: • The viscosity near the main FO pump is a little lower than when the fuel is injected • As the fuel comes from the Service Tank to the engine its increased in temperature • We should therefore calculate the pipe losses at a viscosity averaged from Service Tank temperature at say 55ºC to 120ºC at the transfer pump up to the main FO pump
1000Redwood Nº From 4 to 3 the temperature increases and the viscosity drops 15 cts 9 cts 9cts at Main Fuel Pump Pressure 15cts at Main Fuel Pump Pressure
Consider two plates Load Absolute Viscosity = Stress Shear Rate
Stress Shear Rate Units of Viscosity Stress Absolute Viscosity = Shear Rate Absolute Viscosity (units) = poise
Units of Viscosity Stress Shear Rate Absolute Viscosity Units are called centipoise Kinematic Viscosity = Absolute Viscosity / density
Units of Viscosity Kinematic Viscosity Although the normal units of Kinematic Viscosity are centistokes they are sometimes in mm²/s We could find the pressure exerted by a fluid by using these formulas and hence the Pressure drop per metre length
Moody Diagram We use this diagram to find the Friction Factor (f) and f is used in finding the pressure losses in a pipe (metres) (Pa) (The tables previously handed out are directly related to Moody Chart values)
Relative Roughness Pipes can are of different roughness internally and this affects the pressure losses. As pipes age roughness factors will increase – this is particularly true for water carrying pipes
Relative Roughness For constant Reynolds Number If is increased as the Friction Factor (f) decreases Also: If increases as the value of in the turbulent zone increases
Reynolds Number Absolute and Kinematic Viscosity is used to define the Reynolds Number V = velocity v = kinematic viscosity D = pipe internal diameter
Examples • Oil of density 800kg/m³ has a kinematic viscosity of 40cts. Calculate the critical velocity when flowing in a pipe of 50mm diameter • A Reynolds Number of 2000 is normally selected for find the “critical velocity”
Surface Roughness Coefficient • We use more accurate charts when working out pipe Friction Factors • Mean surface roughness coefficient (k) • Diameter (D)
Moody Chart • We use a slightly different method • Mean surface roughness coefficient (k) • It gives more accurate results
Finding the Friction Factor Friction Factor (f)