Download
1 / 31
310 likes | 466 Views
Observed and simulated variability of the North Atlantic subpolar gyre Helge Drange & Co

E N D
Observed and simulated variability of the North Atlantic subpolar gyre Helge Drange & Co G. C. Rieber Climate Institute, the Nansen Center, Bergen, Norway Bjerknes Centre for Climate Research, Bergen, Norway Geophysical Institute, University of Bergen, Norway Nansen-Zhu International Research Centre, Beijing, China
NOClim-cited: Curry & Mauritzen (2005); Hatun et al. (2005) NOClim-relevant: Orvik and Skagseth (2005); Mauritzen et al. (2006); Siegismund et al. (2006)
Orvik, Kjell Arild; Skagseth, Øystein (2005), Heat flux variations in the eastern Norwegian Atlantic Current toward the Arctic from moored instruments, 1995–2005. Geoph. Res. Lett., 32, No. 14, L14610 10.1029/2005GL023487
Orvik, Kjell Arild; Skagseth, Øystein (2005), Heat flux variations in the eastern Norwegian Atlantic Current toward the Arctic from moored instruments, 1995–2005. Geoph. Res. Lett., 32, No. 14, L14610 10.1029/2005GL023487
“...The extreme temperature increase of 1 oC appears, however, to be independent of the current strength. A future challenge here will be to reveal the cause of this extraordinary warming...” Orvik, Kjell Arild; Skagseth, Øystein (2005), Heat flux variations in the eastern Norwegian Atlantic Current toward the Arctic from moored instruments, 1995–2005. Geoph. Res. Lett., 32, No. 14, L14610 10.1029/2005GL023487
F I R
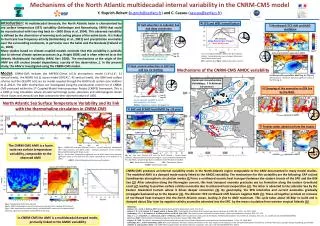
F I R F R I MICOM The subpolar gyre influence SSH EOF (Häkkinen and Rhines, Science, 2004) Altimetry
Observed and simulated salinity anomalies from about 1970 to present Observed Simulated Irminger (I) Faroe (F) Rockall (R)
WNAW ENAW (inverted) The gyre shape and the Rockall Trough Fresh Saline
EOF1 Wind stress curl (26%) EOF1 Buoyancy flux (19%) Red: SSH PC1 Black: SLP PC1 Green: PC1 Wind stressBlue: PC1 Buoyancy flux
Summary: The dynamics of the N-Atl subpolar gyre is of key importance for the poleward transport of heat and salt The dynamics of the N-Atl subpolar gyre is largely governed by winter time bouyancy forcing Decadal-scale coupled atm-ocean mode possible - needs investigation! (coupled model system required) Current generation of OGCMs is able to complement observations NOClim has provided important insight into the variability of the (marine) climate of the N-Atl