Download
1 / 14
140 likes | 271 Views
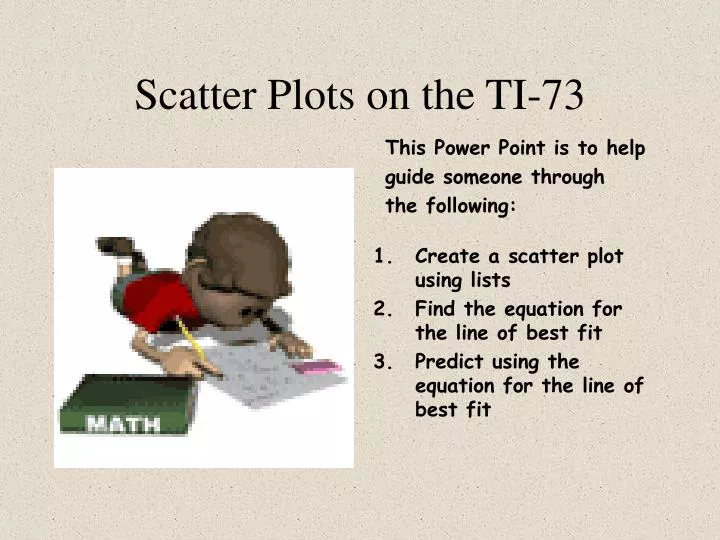
Scatter Plots on the TI-73. This Power Point is to help guide someone through the following:. Create a scatter plot using lists Find the equation for the line of best fit 3. Predict using the equation for the line of best fit. Scatter Plots on the TI-73. Putting Data in Lists

E N D
Scatter Plots on the TI-73 This Power Point is to help guide someone through the following: • Create a scatter plot using lists • Find the equation for the line of best fit 3. Predict using the equation for the line of best fit
Scatter Plots on the TI-73 Putting Data in Lists • Hit the LIST button • Enter data under L1 Type: 1, 2, 3, 4, 5, 6 • Hit ENTER after entering the 6 4. Hit the right arrow
Scatter Plots on the TI-73 • Now enter data under L2 Type: 15, 20, 28, 32, 35, 40 • Hit ENTER after entering the 40 7. Now we are ready to display our scatter plot!
Scatter Plots on the TI-73 • Hit 2ND and Y= • Hit ENTER on the 1: • There is a cursor blinking on the On • Hit ENTER on the ON – this turns on Plot1 • Make sure that Xlist: has L1 and Ylist: has L2
Scatter Plots on the TI-73 • Hit ENTER on the first option after Type: • Hit the WINDOW button 15. Set a range for x and y that fits your data
Scatter Plots on the TI-73 • Use the following for the example data: Xmin= 0 Xmax= 10 Xscl= 1 Ymin= 0 Ymax= 50 Yscl= 5
Scatter Plots on the TI-73 • Now hit GRAPH – a scatter plot should appear • Now we can find the line of best fit for the scatter plot • Hit 2ND and LIST 20. Arrow over to CALC
Scatter Plots on the TI-73 • Arrow down to 5: LinReg(ax+b) • Hit ENTER and you should see LinReg(ax+b) • Hit ENTER again and you should see the information that gives you the equation for the line of best fit
Scatter Plots on the TI-73 • You should see y=ax+b a=4.971428571 b=10.93333333 Now we need to get the equation into Y= so that it will be graphed
Scatter Plots on the TI-73 • Hit 2ND Y= You should now see a Cursor blinking beside Y1= • Hit 2ND APPS • Arrow DOWN and hit ENTER on 3:Statistics...
Scatter Plots on the TI-73 • Now Arrow RIGHT to EQ and hit ENTER on 1:RegEQ • The equation for the line of best fit should be in the Y1 Y1=4.9714285714287X +10.933333333333
Scatter Plots on the TI-73 30. Now hit GRAPH and the graph of the regression line should appear!
Using the Line of Best Fit to Predict • Hit 2ND WINDOW and you now have options for your TABLE SETUP • Hit ENTER on Ask over from Indpnt: 3. Hit ENTER on Auto over from Depend:
Using the Line of Best Fit to Predict • Hit 2ND GRAPH • Now type in a value for X under the X column For example: Type in 20 and you should get 110.36