Download
1 / 6
60 likes | 168 Views
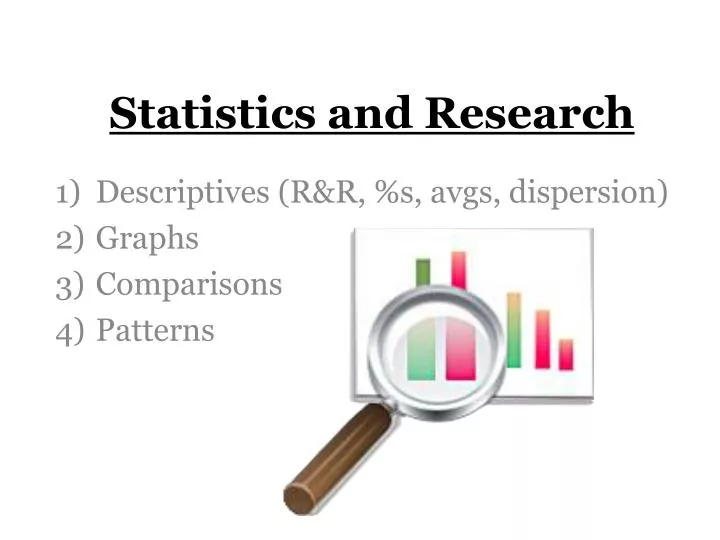
Statistics and Research. Descriptives (R&R, %s, avgs , dispersion) Graphs Comparisons Patterns. Rates. Rate = proportion times a constant Prop = number / possible constant = depends on variable, the more rare, the bigger the constant 2) Crime rates are per 100,000 population. Ratios.

E N D
Statistics and Research Descriptives (R&R, %s, avgs, dispersion) Graphs Comparisons Patterns
Rates Rate = proportion times a constant Prop = number / possible constant = depends on variable, the more rare, the bigger the constant 2) Crime rates are per 100,000 population
Ratios Ratio = one frequency (f) divided by another *If possible, put bigger value in numerator 2) Use cross-multiplication to solve for future situations
Averages Mode = biggest category (fashion, Nominal) Median = middle category (strip, Ordinal) Mean = balance point (teetor totter, Interval)
Dispersion (spread) IQV = zero to 1, fraction (potato, Nominal) Range = max-min distance (property, Ordinal) Standard Deviation = typical distance from mean (measuring stick, Interval)
Graphic Advice 1) Include a meaningfully enticing title 2) Specify the number of cases in the analysis 3) Label all units and categories 4) Specify the source for the data 5) Pick the right graph for the job pie: relative size of the cats bar: limited comparisons (<5) trend (line): many comparisons table: lots and lots of data *Overall, the graph must speak for itself, easily!