Download
1 / 32
340 likes | 487 Views
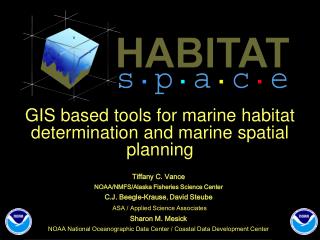
Practical tools, methods and approaches to support marine planning. Vanessa Stelzenmüller 1 , Janette Lee 2 , Eva Garnacho 2 & Stuart Rogers 2 1) vTI - Institute of Sea Fisheries, Hamburg, Germany 2) Centre for Environment, Fisheries & Aquaculture Science (CEFAS), Lowestoft, UK. Outline.

E N D
Practical tools, methods and approaches to support marine planning Vanessa Stelzenmüller1, Janette Lee2, Eva Garnacho2 & Stuart Rogers2 1) vTI - Institute of Sea Fisheries, Hamburg, Germany 2) Centre for Environment, Fisheries & Aquaculture Science (CEFAS), Lowestoft, UK
Outline • Why do we need marine planning? • Practical tools, methods and approaches to support marine planning • Example 1: Mapping human activities and human pressures • Example 2: A geospatial modeling framework to quantify the risk of cumulative impacts of human activities • Example 3: BN-GIS framework to assess marine planning opinions
1. Introduction–Why do we need marine planning? • Multiple human uses of the sea lead to two types of conflicts: 1) uses and environment and 2) between uses • Potential conflicts should be solved by a more strategic ecosystem approach to marine management • A tool to implement an ecosystem approach to marine management is marine planning (MP) • Marine planning (MP) manages the spatial and temporal distribution of human activities to achieve ecological, economic, and social objectives • Practical (spatial explicit) tools and methods are required to support the implementation of MP
2. Tools to support marine planning– Example 1 Example 1: Mapping of human activities and human pressures
2. Tools to support marine planning– Example 1 • How many activities ? • Where are the busiest areas? GIS tool to count the number of activities
2. Tools to support marine planning– Example 1 • From human activities to human pressures - how to convert fishing activity with physical impact on the seabed in fishing pressure maps? • Time series of VMS data (2001-2006) of UK and non-UK fishing vessels ≥ 15 m using beam trawls, scallop dredges and otter trawls • Conversion of VMS pings to fishing pressure layers More details on the method in Eastwood et al. (2007), Mills et al. (2007), and Stelzenmüller et al. (2008)
2. Tools to support marine planning– Example 1 • Annual aggregated fishing pressure as proportion of cell (2 x 2 nm) fished Stelzenmüller et al. (2008). ICES Journal of Marine Science, 65: 1081–1091.
2. Tools to support marine planning– Example 1 • Average proportion of UK marine landscapes fished Stelzenmüller et al. (2008). ICES Journal of Marine Science, 65: 1081–1091.
2. Tools to support marine planning– Example 2 Example 2: A geospatial modelling framework to quantify the risk of cumulative impacts • Ecosystem approach to marine management such as marine planning (MP) needs to consider a range of human activities • Human activities vary in their intensities, footprints and impacts on the marine environment • MP requires an evaluation of the risk of cumulative and interactive effects of numerous human activities
Human activity 1 Pressure A Human activity 2 Human activity 3 Pressure B Human activity 4 2. Tools to support marine planning– Example 2 • Human activities exert pressures
2. Tools to support marine planning– Example 2 • Ecosystem components are sensitive to different pressures • Impact = Pressure * Sensitivity • Cumulative impacts = combined impacts
Selection of human activities 2. Tools to support marine planning– Example 2 Activity 1: footprint and intensity Mapping ecosystem components Mapping of human pressures A Activity 2: footprint and intensity Sensitivity scores of ecosystem components Fuzzyfication of pressure layers Activity 3: footprint and intensity Mapping of human pressures B Impact maps …… … GIS – Multi-criteria-analysis CI scenario 1 CI scenario 2 CI scenario 3 CI scenario 4 Scenario evaluation Stelzenmüller et al (2010). MEPS 398: 19–32.
Selection of human activities 2. Tools to support marine planning– Example 2 Human uses geodata - available for UK&W waters • Fishing (bottom trawling) • Wind farm (licence areas and application area) • Oil and gas (well heads and platforms) • Cables • Pipelines • Aggregates (licence area and application area) • Disposal • Other constraining activities (e.g. wrecks, obstructions)
Sensitivity scores of ecosystem components 2. Tools to support marine planning– Example 2 Habitat map for sensitivity scores Conner et al (2006) Taken from DEFRA (2007) Cost impact of marine biodiversity policies on business – the marine bill, London. ……… ………
2. Tools to support marine planning– Example 2 Impact ABR Stelzenmüller et al (2008). ICES Journal of Marine Science, 65:1081-1091 Sensitivity Score ABR Impact maps
2. Tools to support marine planning– Example 2 GIS Multi-criteria-analysis (GIS - MCA) Scenario 2: Linear weights Scenario 4: Simulated stakeholder consultation Scenario 1: Equal weights Scenario 3: Logistic weights Pressure ranked by likelihood of recovery
2. Tools to support marine planning– Example 2 Scenario 1: Equal weights Scenario 3: Logistic weights
2. Tools to support marine planning– Example 2 • Testing the sensitivity of predicted cumulative impacts by randomising pressure ranking Scenario evaluation
2. Tools to support marine planning– Example 2 Conclusions • Model outputs depend on input data quality • Uncertainty is partly captured by fuzzyfication of pressure layers - uncertainty remains for sensitivity measures • Risk assessment framework highlights both range of possible modelled scenarios and range of uncertainty • For decision making in the case of remaining uncertainty models with less strong assumptions should be used
2. Tools to support marine planning– Example 3 Example 3: Bayesian Belief networks (BN)-GIS framework to assess marine planning options • Visualisation of relationships between sensitive marine landscapes, human activities, cumulative pressures and landscape vulnerability • Spatial assessment of uncertainty of marine planning options • Baseline scenario – Current status on UK continental shelf • Scenario 1 – What are the mitigation measures under a given marine planning objective ? • Scenario 2 – How does the vulnerability state change after the implementation of a spatial management measure?
2. Tools to support marine planning– Example 3 CPEC = Σ1-N IntensityHA1 + .. IntensityHAN Conner et al (2006)
2. Tools to support marine planning– Example 3 SensitivityEC = Σ1-N SensitivityHA1 + ..SensitivityHAN VulnerabilityEC = CPEC * SensitivityEC
2. Tools to support marine planning– Example 3 BN GIS: Quantitative, qualitative, and categorical data • BBNs representprobabilistic correlative and causal relationships • BBNs specify joint and conditional relationships, and express uncertainty • Conditional probability tables are populated from GIS data Stelzenmüller et al (submitted). Marine Pollution Bulletin.
2. Tools to support marine planning– Example 3 Baseline scenario UKCS • Probabilities of the parent nodes reflected the proportion of grid cells in the respective state or category
2. Tools to support marine planning– Example 3 • Scenario 1: What are the necessary management measures to achieve a planning objective on cumulative pressure ?
2. Tools to support marine planning– Example 3 • Scenario 1 outcomes in relation to baseline scenario (current state): • Human activities related to the oil and gas industry and demersal fishing need to be regulated most
2. Tools to support marine planning– Example 3 • Scenario 2: How does the vulnerability state change in the planning area after the relocation of fishing pressure ?
2. Tools to support marine planning– Example 3 Before the implementation: After the implementation: • Northern offshore area showed a reduced probability of being in vulnerability state 1 and 2 • Southward shift of increased vulnerability, but “pristine” areas experienced increase in fishing pressure and showed increased vulnerability
2. Tools to support marine planning– Example 3 Before the implementation: After the implementation: • Northern offshore area showed a reduced probability of being in vulnerability state 3 and 4 • Overall decrease of surface area being in vulnerability state 4
2. Tools to support marine planning– Example 3 Our BN-GIS framework…. • is constrained by the available geodata, and in this case does not reflect a comprehensive assessment of vulnerability • can be applied at any spatial scale and adapted to any relationships when data becomes available • can be used to address a wide range of questions and decisions, with their potential consequences • allowed to examine the spatial pattern of uncertainty related to planning targets
Future work Future work requires …. • the inclusion of more ecosystem components • the consideration of socio-economic planning objectives to promote an integrated approach for the development of marine plans • the development of planning tools that consider environmental change
Thank you for your attention ! vanessa.stelzenmueller@vti.bund.de