Download
1 / 21
220 likes | 393 Views
Large- scale water quality modeling. Hot spots and causes of water pollution. The modeling framework Model results for Africa Progress since October 2013 Hot spots of water pollution Fecal Coliform bacteria Risk to human health BOD Threat to inland fishery

E N D
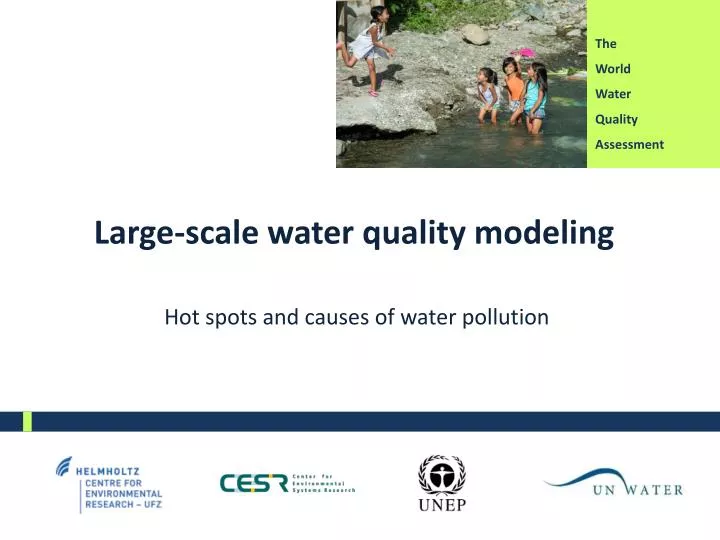
Large-scalewaterqualitymodeling Hot spots and causes of water pollution
The modelingframework • Model resultsforAfrica • Progress sinceOctober 2013 • Hot spotsofwaterpollution • FecalColiformbacteria Riskto human health • BOD Threattoinlandfishery • Causesofwaterpollution • Main sectorscontributingtopollution • Conclusions & preliminaryfindings • Next steps • Outline
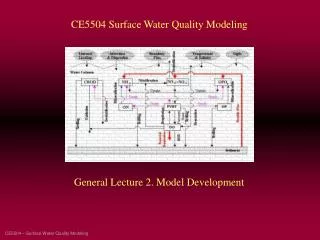
spatial: 5’ temporal: monthly results: monthly spatial: 5’ temporal: daily results: daily/monthly • Modeling framework • discharge, runoff, • flow velocity WaterGAP3 Hydrology Model WorldQual Water Quality Model consumptive water use return flow spatial: 5‘ temporal: daily results: daily/monthly/yearly WaterGAP3 Water Use Models agriculture domestic manufacturing electricity production
Progress sinceOctober 2013 point sources diffuse sources urban surface runoff manufacturing (wastewater) • domestic (urban) • sewage • domestic (rural) • sewage • hanginglatrines • domestic • septictanks • pitlatrines • inadequatesanitation agriculture (organicfertilizer) agriculture (industrialfertilizer) natural back-ground “scattered settlements” Data from Joint Monitoring Programme; country files (1980-2011)
2010 • Loadings: Fecalcoliformbacteria Human andanimalinput
Dilution capacity Climate normal period (1971-2000) Example: Modeled FC concentration at Mhlatuze River, South Africa January to December 2010
February 2010 • FC in-streamconcentration
February 2010 August 2010 • Comparison: FC in-streamconcentration
…but noimprovementoftreatmentlevels February 2010 • Sensitivityanalysis: Assuming 100% connectivity…
Total BOD loads in 2010 ~ 8.5 milliontons • BOD loadings in 2010
February 2010 August 2010 • BOD in-streamconcentration
Uncertaintyofmodelassumptions High: assuming 7.5% ofwashed-off manurecontributesto BOD load Low: assuming 3% ofwashed-off manurecontributesto BOD load
Sensitivityanalysisfor BOD: “low rate“ assumption Total BOD loads in 2010 ~ 5 milliontons
February 2010 August 2010 • Hot spotsof BOD for“low rate“ assumption
High: assuming 7.5% ofwashed-off manurecontributesto BOD load • Model validation Low: assuming 3% ofwashed-off manurecontributesto BOD load
Example: Total BOD loads in theNileriverbasin contributingloads per country [%] • Transboundaryriverbasinscale
First time: • Synthesizeinformationaboutpopulation, sanitationandconnectivityandmakespatially explicit for all ofAfrica • Computeloadsoforganicpollutionandbacterialcontaminationforeachriverbasin in Africa (gridcellbasis) • Geographiccomparisonof BOD andfecalcoliformloadings in Africa • Calculationof BOD andcoliformlevelsfor all rivers in Africa • Estimationofhotspotwaterpollutionareas in Africa • Conclusions
Hot spotareas: 17% ofpopulationliving at bigriverswithbacterialcontamination >1000cfu/100ml in Africa • Hot spotareas: Dilution capacity + magnitudeofloadings • Magnitude of BOD loadinguncertain (manurerunoff) • Most important source of BOD: manure runoff; least important: urban surface runoff • Source profile of BOD loadings vary greatly between countries (e.g. Somalia: manure runoff; Egypt: urban domestic) • Total BOD loads steadily increased in Africa between 1990 and 2010 (increasing population, livestock, connectivity) • High potential toprovidepolicy-relevant overviewofwaterqualityissuesforAfricaandotherregions • Preliminaryfindings
Further improvementofestimatesforAfrica • getting regional feedback • Extension ofestimatestoAsiaandLatinAmerica • Extension ofestimatestoinclude: • other water quality parameters (total dissolved solids, total N, total P, water temperature) • lakes • Apply water quality guidelines as thresholds • Merger of model-driven & data-drivenanalyses: threatsto human health & inlandfisheries (foodsecurity ) andpolicyresponses • Next steps