Download
1 / 16
160 likes | 332 Views
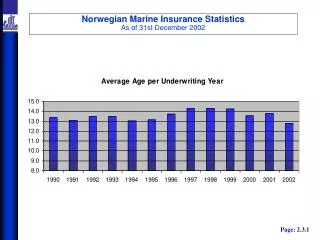
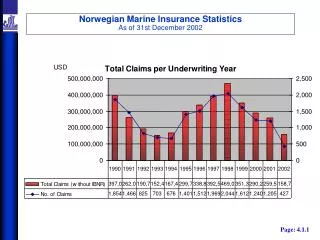
Norwegian Marine Insurance Statistics As of 31 December 2003. Number of Claims per Type of Vessel. Total 7,743 claims. Total 1,028 claims. Total 577 claims. Page: 4.1.2.a. Norwegian Marine Insurance Statistics As of 31 December 2003. Cost of Claims per Type of Vessel. Total $1,843 mill.

E N D
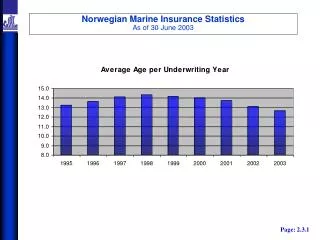
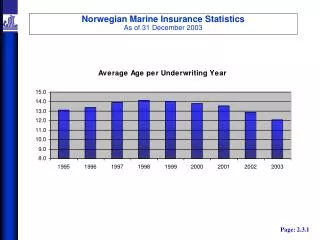
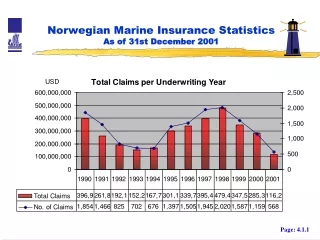
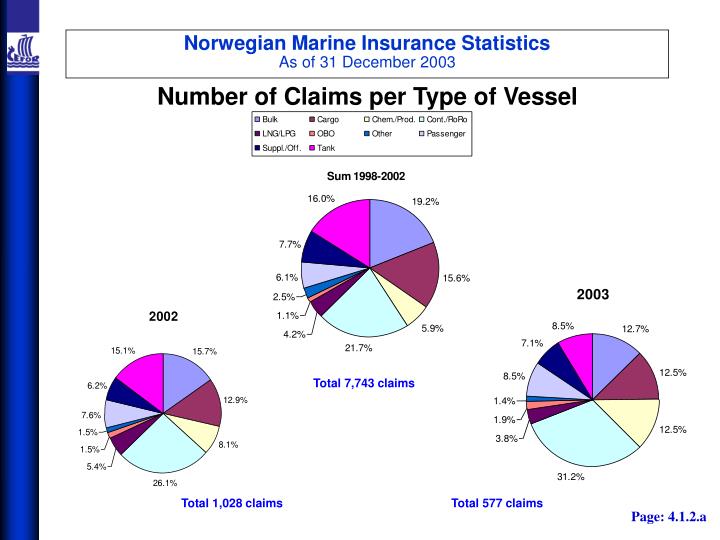
Norwegian Marine Insurance StatisticsAs of 31 December 2003 Number of Claims per Type of Vessel Total 7,743 claims Total 1,028 claims Total 577 claims Page: 4.1.2.a
Norwegian Marine Insurance StatisticsAs of 31 December 2003 Cost of Claims per Type of Vessel Total $1,843 mill. Total $126 mill. Total $325 mill. Page: 4.1.2.b
Norwegian Marine Insurance StatisticsAs of 31 December 2003 Number of Claims per Age Group Total 7,743 claims Total 1,028 claims Total 577 claims Page: 4.1.3.a
Norwegian Marine Insurance StatisticsAs of 31 December 2003 Cost of Claims per Age Group Total $1,843 mill. Total $126 mill. Total $325 mill. Page: 4.1.3.b
Norwegian Marine Insurance StatisticsAs of 31 December 2003 Number of Claims per Type of Casualty Total 7,743 claims Total 1,028 claims Total 577 claims Page: 4.1.4.a
Norwegian Marine Insurance StatisticsAs of 31 December 2003 Cost of Claims per Type of Casualty Total $1,843 mill. Total $325 mill. Total $126 mill. Page: 4.1.4.b
Norwegian Marine Insurance StatisticsAs of 31 December 2003 Page: 4.1.5
Norwegian Marine Insurance StatisticsAs of 31 December 2003 Page: 4.1.6
Norwegian Marine Insurance StatisticsAs of 31 December 2003 Page: 5.1.1
Norwegian Marine Insurance StatisticsAs of 31 December 2003 Page: 5.1.2
Norwegian Marine Insurance StatisticsAs of 31 December 2003 Calculation methods for Index Key Factors and Adjusted Rating Development 1)Rating Quality Index Adjustment Factors: V = (Av.SI year x - Av. SI 1995) / 100 * 0,3 VP = Av.Prem. per vessel year - V PAPB = VP - (Av.SI 1995 * 0,257) / 100 SPAB = PAPB * Av. (F)DWT per vessel 1995 / Av. (F)DWT per vessel year x Adjusted values: Adjusted Premium = SPAB + (Av.SI 1995 * 0,257 / 100) Adjusted Standard Deductible = Av.Std.Ded. * Av.(F)DWT 1995 / Av.(F)DWT year x (Adj.Prem. + 50% (Standard Deductible < 500,000))rate = (Adj.Prem.+0,5 * (Adj.Std.Ded < 500,000)) / (Av.SI1995) * 100 Rating Quality Index = (Adj.Prem + 50% (Std.Ded.< 500,000)) rate year x / (Adj.Prem. + 50% (Std.Ded.< 500,000)) rate 1995 * 100 for x = 1995 to 2003 2) Cash Index Factor year x = Net Premium year x+1 / Net Premium year x Net Premium in this case is the sum over all ships renewed from year x to year x+1 with a Sum Insured and a Standard Deductible within a 90% margin in relation to the previous years Sum Insured and Standard Deductible Cash Index (1995) = Factor 1995 Cash Index (year x) = Factor year x * Cash Index (year x-1) for x = 1996 to 2003 3)Loss Ratio Index = Loss Ratio year x / Loss Ratio 1995 for x = 1995 to 2002 (Loss Ratio = Total Claims / Net Premium) 4) Claims Cost Index = Claims Cost year x / Claims cost 1995 for x = 1995 to 2002 5) Claims Frequency Index = Claims Frequency year x / Claims Frequency 1995 for x = 1995 to 2002 (Claims Frequency = No. of claims / No. of vessel years) Page: 5.2.0
Norwegian Marine Insurance StatisticsAs of 31 December 2003 Rating Development: Premium = Net Premium per Vessel in % of Sum Insured year x / Net Premium per Vessel in % of Sum Insured 1995, for x = 1995 to 2003 Premium + (50% of Standard Deductible < 500,000) = (Net Premium per Vessel + 50% (Standard Deductible < 500,000)) in % of Sum Insured year x/ (Net Premium per Vessel + 50% (Standard Deductible < 500,000)) in % of Sum Insured 1995 for x = 1995 to 2003 Adjusted Rating Development: Adjustment Factors: V = (Av.SI year x - Av. SI 1995) / 100 * 0,3 VP = Av.Prem. per vessel year - V PAPB = VP - (Av.SI 1995 * 0,257) / 100 SPAB = PAPB * Av.FDWT per vessel 1995 / Av.FDWT per vessel year x Adjusted values: Adjusted Premium = SPAB + (Av.SI 1995 * 0,257 / 100) Adjusted Standard Deductible < 500,000 = (Average Standard Deductible < 500,000) * Av.FDWT 1995 / Av.FDWT year x (Adj.Prem. + 50% (Standard Deductible < 500,000))rate = (Adj.Prem + 50% (Adjusted Standard Deductible < 500,000)) / Av.SI 1995 * 100 Adjusted Rating Development: Premium = Adjusted Premium year x / Adjusted Premium 1995, for x = 1995 to 2003 Premium + 50% (Standard Deductible < 500,000) = (Adj.Prem + 50% (Standard Deductible < 500,000)) rate year x / (Adj.Prem. + 50% (Standard Deductible < 500,000)) rate 1995 * 100 for x = 1995 to 2003 Page: 5.2.0 contd.
Norwegian Marine Insurance StatisticsAs of 31 December 2003 Page: 5.2.1
Norwegian Marine Insurance StatisticsAs of 31 December 2003 Page: 5.2.2
Norwegian Marine Insurance StatisticsAs of 31 December 2003 Page: 5.2.3
Norwegian Marine Insurance StatisticsAs of 31 December 2003 Comment: Deductibles <=97 based on database before restructuring of underwriting years 1995-97 Deductibles >= 98 based on the ”new” database Page: 5.2.4