Download
1 / 46
460 likes | 567 Views
Middle School Math Initiative for Florida Rigor Relevance Reading. Florida and the Islands Comprehensive Center at ETS International Center for Leadership in Education Florida Council of Teachers of Mathematics Florida Department of Education. Understanding Probability. S = Sample Space

E N D
Middle School Math Initiative for Florida RigorRelevance Reading Florida and the Islands Comprehensive Center at ETSInternational Center for Leadership in EducationFlorida Council of Teachers of Mathematics Florida Department of Education
S = Sample Space The Sample Space is the set of all possible outcomes in a probability experiment. Let S = { 1,2,3,4,5,6,7,8,9,10} then n(S)=10 Find n(A) if A = {the whole numbers between 5 and 12} n(A) = 6 sinceA = {6,7,8,9,10,11}
An Event consists of a set of outcomes of a probability experiment. The probability, P, of Event (E) with sample space, S, is defined as the ratio of n(E) to n(S) i.e., P(E) =
A bag of marbles has 3 red and 2 green marbles in it. n(S) = 5 E= pull out a green marble Find the probability of pulling out a red marble if you put your hand in the bag and pull out one marble. Find P(E).
Another way to say that: P(Red) = n(successes) = n(total outcomes) Find P(green) =
What is the highest a probability value can be? What is the lowest a probability value can be? In fact, 0 ≤ p ≤ 1 Or, if you prefer to use percents: Every probability is between 0% and 100%.
In summary……… Sample Space Event P(E) =
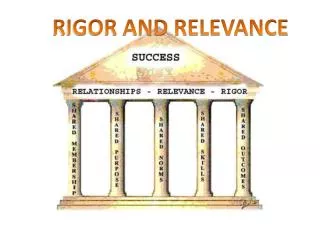
Philosophy • Rigor • Relevance • Relationships • All Students
Philosophy • Relationships • Relevance • Rigor • All Students
Rigor • Rigor Means • Level of critical thinking skills • Level of math application
Relevance Relevance is more than passing the math FCAT My only skill is taking tests
Rigor/Relevance Framework 6 Knowledge D C 5 4 3 A B 2 1 Application 1 2 3 4 5
Assimilation of knowledge Thinking Continuum Acquisition of knowledge
Knowledge Taxonomy 6. Evaluation 5. Synthesis 4. Analysis 3. Application 2. Comprehension 1. Recall Knowledge
Action Continuum Acquisition of knowledge Application of knowledge
Application Model 5 Application to real-world unpredictable situations 4 Application to real-world predictable situations 3 Application across disciplines 2 Application within discipline 1 Knowledge of one discipline
R&R Framework ...A Useful Tool to evaluate • Curriculum • Instruction • Assessment • Activities
Quadrant D Lessons • 6th Grade Math Big / Supporting Ideas • District Need / Big / Supporting Idea • 6th Grade Student Interest • 70 Quadrant D 6th Grade Lessons • Edited • Posted Online by FLDOE
C O R R Collaborating Online for Rigor and Relevance
Develop Connect Apply Explore Share COMPONENTS
Strategies for Increasing Reading Comprehension in Mathematics
Teaching key reading comprehension strategies for only 15 minutes a week can significantly increase student achievement.
Affinity Anticipation Guide Cloze Concept Definition Map Cornell Graphic Organizer DR/TA Fishbone K-W-L-S Learning Logs Minute Paper Pairs-Read Paraphrasing QAR RAFT Reciprocal Teaching Rock Around the Clock SQ3R Structured Note-taking Summarizing Venn Diagram Vocabulary in Context Reading Comprehension Strategies
Concept Definition Map Reading Comprehension Strategy
DIRECT READING/ THINKING ACTIVITY Reading Comprehension Strategy
SQ3R Survey-Question-Read-Recite-Review Reading Comprehension Strategy
CLOZE Reading Comprehension Strategy
VENN DIAGRAM Reading Comprehension Strategy
Middle School Mathematics Initiative! “A Journey Towards Mathematics Excellence” It’s All About Math! FASA Super Conference July 20, 2007
It’s All About Math! Sponsored by: Florida Department of Education Florida and the Islands Comprehensive Center at ETS (FLICC) In Partnership with: The International Center for Leadership in Education ESCORT Florida Council of Teachers of Mathematics PAEC
It’s All About Math! Participants: 2006 - 2008 First Cohort 30 Participating Districts Lab Schools Charter School Florida School for the Deaf and Blind
It’s All About Math! Goals: • Increase the rigor and relevance of middle school mathematics instruction with a focus on sixth grade • Increase the use of research-based literacy strategies for use in middle school mathematics classrooms • Increase the use of data to inform instruction • Build a statewide support network focused on the improvement of middle school mathematics curriculum and instruction • Increase awareness of new Florida mathematics standards and legislation impacting middle school mathematics classrooms
It’s All About Math! Regional Workshops: Year 1 2 Regional Institutes Increasing Rigor and Relevance in the Mathematics Classroom Strategic Reading in the Content Areas Summer Institute Teaching to Mastery – Focus on Using the New Florida Standards for Mathematics to Achieve High Levels of Learning for All Students
It’s All About Math! Regional Workshops: Year 2 3 Regional Institutes Using the New Mathematics Standards to develop Content Modules Closing the Achievement Gap – Strategies to Help Struggling Students Building Student/Teacher Relationships: Transitioning to Middle School
It’s All About Math! Materials/Resources: Rigor / Relevance Handbook Instructional Strategies Handbook Curriculum Matrix Kit Strategic Reading in the Content Area Kit 1 Year Membership in the Successful Practices Network Support of a Liaison Opportunity for 25 teachers to participate in Collaborating Online for Rigor and Relevance (CORR)
I have come to a frightening conclusion. I am the decisive element in the classroom. It is my personal approach that creates the climate. It is my daily mood that makes the weather. As a teacher, I possess tremendous power to make a child's life miserable or joyous. I can be a tool of torture or an instrument of inspiration. I can humiliate or humor, hurt or heal. In all situations, it is my response that decides whether a crisis will be escalated or de-escalated, and a child humanized or de-humanized." • Haim Ginott
Rigor/Relevance Framework 6 • Obtain historical data about local weather to predict the chance of snow, rain, or sun during year. • Test consumer products and illustrate the data graphically. • Plan a large school event and calculate resources (food, decorations, etc.) you need to organize and hold this event. • Make a scale drawing of the classroom on grid paper, each group using a different scale. • Analyze the graphs of the perimeters and areas of squares having different-length sides. • Determine the largest rectangular area for a fixed perimeter. • Identify coordinates for ordered pairs that satisfy an algebraic relation or function. • Determine and justify the similarity or congruence for two geometric shapes. D C • Express probabilities as fractions, percents, or decimals. • Classify triangles according to angle size and/or length of sides. • Calculate volume of simple three- dimensional shapes. • Given the coordinates of a quadrilateral, plot the quadrilateral on a grid. 5 4 A 3 • Calculate percentages of advertising in a newspaper. • Tour the school building and identify examples of parallel and perpendicular lines, planes, and angles. • Determine the median and mode of real data displayed in a histogram • Organize and display collected data, using appropriate tables, charts, or graphs. 2 B A 1 1 2 3 4 5
Rigor/Relevance Framework 6 • Obtain historical data about local weather to predict the chance of snow, rain, or sun during year. • Test consumer products and illustrate the data graphically. • Plan a large school event and calculate resources (food, decorations, etc.) you need to organize and hold this event. • Make a scale drawing of the classroom on grid paper, each group using a different scale. • Analyze the graphs of the perimeters and areas of squares having different-length sides. • Determine the largest rectangular area for a fixed perimeter. • Identify coordinates for ordered pairs that satisfy an algebraic relation or function. • Determine and justify the similarity or congruence for two geometric shapes. • Calculate percentages of advertising in a newspaper. • Tour the school building and identify examples of parallel and perpendicular lines, planes, and angles. • Determine the median and mode of real data displayed in a histogram • Organize and display collected data, using appropriate tables, charts, or graphs. D C 5 4 B 3 • Express probabilities as fractions, percents, or decimals. • Classify triangles according to angle size and/or length of sides. • Calculate volume of simple three- dimensional shapes. • Given the coordinates of a quadrilateral, plot the quadrilateral on a grid. 2 B A 1 1 2 3 4 5
Rigor/Relevance Framework 6 • Obtain historical data about local weather to predict the chance of snow, rain, or sun during year. • Test consumer products and illustrate the data graphically. • Plan a large school event and calculate resources (food, decorations, etc.) you need to organize and hold this event. • Make a scale drawing of the classroom on grid paper, each group using a different scale. • Analyze the graphs of the perimeters and areas of squares having different-length sides. • Determine the largest rectangular area for a fixed perimeter. • Identify coordinates for ordered pairs that satisfy an algebraic relation or function. • Determine and justify the similarity or congruence for two geometric shapes. D C 5 C 4 3 • Calculate percentages of advertising in a newspaper. • Tour the school building and identify examples of parallel and perpendicular lines, planes, and angles. • Determine the median and mode of real data displayed in a histogram • Organize and display collected data, using appropriate tables, charts, or graphs. • Express probabilities as fractions, percents, or decimals. • Classify triangles according to angle size and/or length of sides. • Calculate volume of simple three- dimensional shapes. • Given the coordinates of a quadrilateral, plot the quadrilateral on a grid. 2 B A 1 1 2 3 4 5
Rigor/Relevance Framework 6 • Analyze the graphs of the perimeters and areas of squares having different-length sides. • Determine the largest rectangular area for a fixed perimeter. • Identify coordinates for ordered pairs that satisfy an algebraic relation or function. • Determine and justify the similarity or congruence for two geometric shapes. • Obtain historical data about local weather to predict the chance of snow, rain, or sun during year. • Test consumer products and illustrate the data graphically. • Plan a large school event and calculate resources (food, decorations, etc.) you need to organize and hold this event. • Make a scale drawing of the classroom on grid paper, each group using a different scale. D C 5 D 4 3 • Calculate percentages of advertising in a newspaper. • Tour the school building and identify examples of parallel and perpendicular lines, planes, and angles. • Determine the median and mode of real data displayed in a histogram • Organize and display collected data, using appropriate tables, charts, or graphs. • Express probabilities as fractions, percents, or decimals. • Classify triangles according to angle size and/or length of sides. • Calculate volume of simple three- dimensional shapes. • Given the coordinates of a quadrilateral, plot the quadrilateral on a grid. 2 B A 1 1 2 3 4 5