Download
1 / 17
170 likes | 474 Views
Post-calibration of Fluorescence Chlorophyll. Brought to you by the “Gang of N” (For All Your Data Analysis Needs) Bill Romano - MD DNR Elgin Perry - Statistics Consultant Marcia Olson - NOAA/CBP Beth Ebersole - MD DNR Mike Lane - ODU. Stations monitored in 2002. Turville Creek

E N D
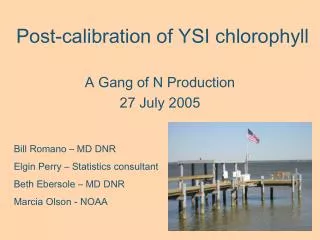
Post-calibration of Fluorescence Chlorophyll Brought to you by the “Gang of N” (For All Your Data Analysis Needs) Bill Romano - MD DNR Elgin Perry - Statistics Consultant Marcia Olson - NOAA/CBP Beth Ebersole - MD DNR Mike Lane - ODU
Stations monitored in 2002 • Turville Creek • Bishopville Prong • Shelltown • Cedar Hall Wharf • Rehobeth • Ben Oaks • Sherwood Forest • Whitehurst • Stonington • Drawbridge
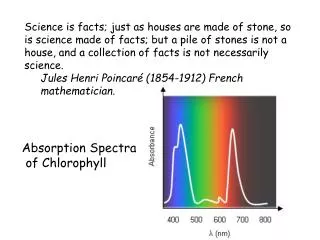
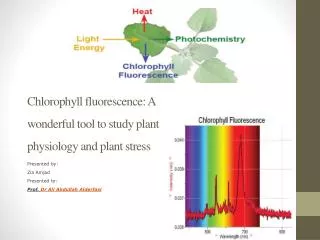
Why Post-calibrate Data • YSI chlorophyll probe measures any compound in the water sample that fluoresces when irradiated with blue light (470 nm). • Most fluorescence is usually due to chlorophyll in phytoplankton, but could be a result of other compounds in the water. • The proposed chlorophyll water quality criteria will be in terms of chlorophyll-a, not “total chlorophyll.”
We Tried Three Methods • Least squares regression method. • YSI’s mean ratio method. • Gang of N’s log ratio method (preferred method).
Post-calibration Methods(Least Squares Regression) • Regress extractive (CE) on fluorescence (CF) (probe-measured) chlorophyll. • CE (predicted) = ß0 + ß1* CF + ∊ • Violates assumption that independent variable is measured without error.
Post-calibration Methods(YSI’s Mean Ratio Method) • Multiply fluorescence chlorophyll (CF) by the mean ratio of time-matched extractive chlorophyll (CE) to CF. • CE (predicted) = CE/CF * CF.
log(x/y)=log x - log y LNRAT = LNCHL_E – LNCHL_F
Post-calibration Methods(Gang of N’s Log Ratio Method) • Log(CE/CF) = ß0 + ß1* X + ∊. • Moves CF to left side of equation, so error is incorporated in the error term. • Working with logs helps conform to assumptions of regression analysis.
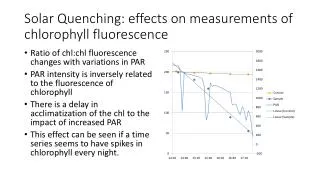
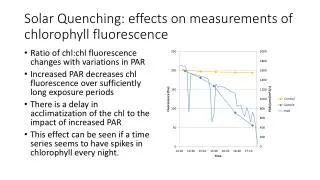
Application of Log Ratio Method(Temperature Effect) • “… the fluorescence of phytoplankton suspensions can show significant temperature dependence” (YSI). • Laboratory tests by YSI indicated that apparent chlorophyll concentration increased when temperature dropped, even though no change in phytoplankton content took place.
Temperature Effect • Regression of log ratio on temperature was significant (p<0.05) for three of ten stations. • Slope estimate for all models was negative, supporting what appears in YSI manual. • Sign of slope was not consistent with temperature and turbidity model. • Turbidity not significant with temperature in the model.
Recommended Adjustment to Fluorescence Using Log Ratio Method • Estimate coefficients by regressing time-matched log10(extractive chlorophyll) – log10(fluorescence chlorophyll) on temperature. • Predicted log ratio = INT + 0.013 * TEMP. • Predicted ratio = 10**PLR. • CHLA(predicted) = PR * fluorescence chlorophyll.