Download
1 / 3
30 likes | 97 Views
Create detailed inset maps for urban centers, using clear legends and marginalia. Highlight traffic flow changes effectively with color-coded ranges. Ensure consistency in legend presentation for easy interpretation.

E N D
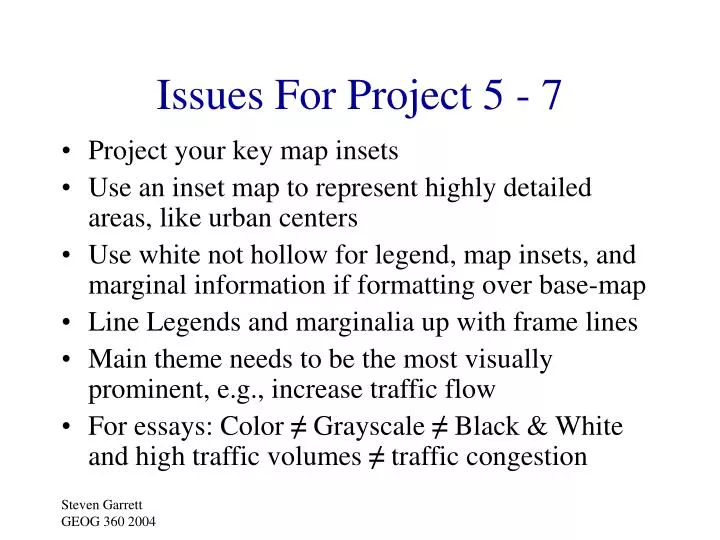
Issues For Project 5 - 7 • Project your key map insets • Use an inset map to represent highly detailed areas, like urban centers • Use white not hollow for legend, map insets, and marginal information if formatting over base-map • Line Legends and marginalia up with frame lines • Main theme needs to be the most visually prominent, e.g., increase traffic flow • For essays: Color ≠ Grayscale ≠ Black & White and high traffic volumes ≠ traffic congestion
Rounding Incorrect Correct* Legend Afternoon Peak Traffic Legend Afternoon Peak Traffic 0 – 5,323 5,324 – 9,993 9,994 – 15,398 15,399 – 19,874 19,875 – 25,421 0 – 5,500 5,501 – 10,000 10,001 – 15,500 15,501 – 20,000 20,001 – 25,500 * Round more precisely if data and audience require it
LegendAfternoon Peak Traffic Negative change -5,001 to - 10,000 0 to -5,000 Positive change 0 to 5,000 5,001 to 10,000 10,001 to 15,000 15,001 to 20,000 20,001 to 25,000 • Representing negative and positive changes • “Pivot” around zero, with increasingly positive or negative values at either end • Use the most prominent color/value to represent the most importantthematicside • Use the same class break ranges on either side with the same thickness of lines