Download
1 / 9
210 likes | 801 Views
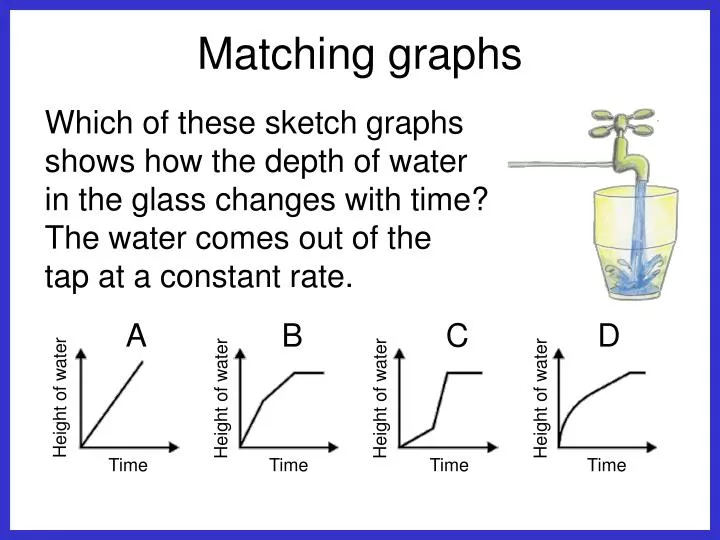
Matching graphs. Which of these sketch graphs shows how the depth of water in the glass changes with time? The water comes out of the tap at a constant rate. A. B. C. D. Height of water. Height of water. Height of water. Height of water. Time. Time. Time. Time. Matching graphs.

E N D
Matching graphs Which of these sketch graphs shows how the depth of water in the glass changes with time? The water comes out of thetap at a constant rate. A B C D Height of water Height of water Height of water Height of water Time Time Time Time
Matching graphs Which of these sketch graphs shows how the depth of water in the glass changes with time? The water comes out of thetap at a constant rate. A B C D Height of water Height of water Height of water Height of water Time Time Time Time
d c a b e f Matching graphs Match each of these sketch graphs to one or more of the glasses below. A B C D Height of water Height of water Height of water Height of water Time Time Time Time
d c a b e f Matching graphs Graph A matches glasses d and e A B C D Height of water Height of water Height of water Height of water Time Time Time Time
d c a b e f Matching graphs Graph B matches b and f A B C D Height of water Height of water Height of water Height of water Time Time Time Time
d c a b e f Matching graphs Graph C matches a A B C D Height of water Height of water Height of water Height of water Time Time Time Time
d c a b e f Matching graphs Graph D matches c A B C D Height of water Height of water Height of water Height of water Time Time Time Time
d c a b e f Matching graphs Graph D matches c A B C D Height of water Height of water Height of water Height of water Time Time Time Time
Matching graphs Draw a glass that, while being filled with water, would give each graph below.