Download
1 / 29
290 likes | 396 Views
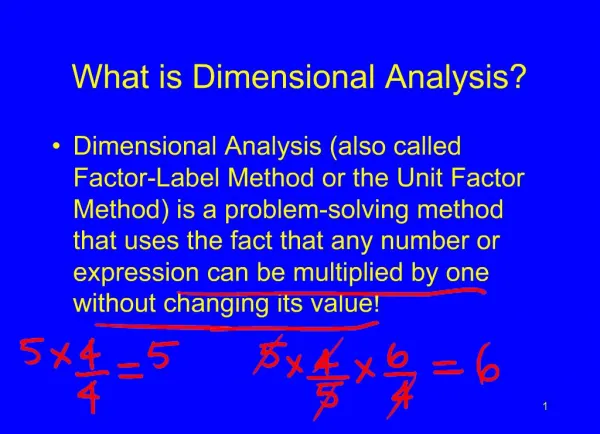
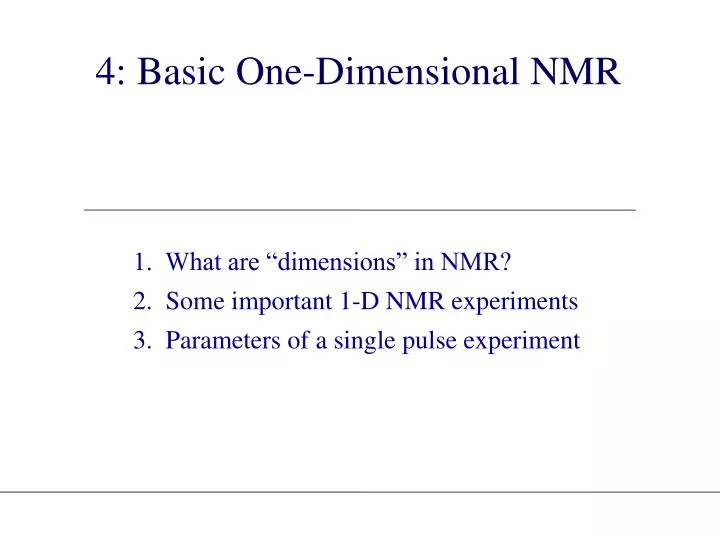
4: Basic One-Dimensional NMR. 1. What are “dimensions” in NMR? 2. Some important 1-D NMR experiments 3. Parameters of a single pulse experiment. What are “dimensions” in NMR?.

E N D
4: Basic One-Dimensional NMR 1. What are “dimensions” in NMR? 2. Some important 1-D NMR experiments 3. Parameters of a single pulse experiment
4-Basic 1-D NMR (Dayrit) What are “dimensions” in NMR? • A 1-D NMR experiment gives a spectrum wherein there is one frequency axis, the x-axis. (The y-axis is the intensity axis.) 1-dimensional NMR: x • ppm (1H, 13C) 2-dimensional NMR: • A 2-D NMR experiment yields a spectrum in which both the x- and y-axes are frequency axes. (The intensity axis is the z-axis and can be plotted as a contour map.) y • ppm (1H, 13C) x • ppm (1H)
4-Basic 1-D NMR (Dayrit) What are “dimensions” in NMR? • However, in terms of the NMR pulse sequence, the dimensions in NMR spectroscopy arise from the use of time during the pulse sequence. • In a 1-D NMR pulse sequence, there is only one variable time parameter, the acquisition time, AQT. • In a 2-D NMR pulse sequence, there are two variable time parameters: an evolution time, t1, and the acquisition time, t2. • The key to understanding the meaning of the dimensions in NMR is to recall that during Fourier transformation, we convert a time-dependent signal (the FID) into a frequency spectrum: t n
4-Basic 1-D NMR (Dayrit) What are “dimensions” in NMR?
4-Basic 1-D NMR (Dayrit) Importance of 1-dimensional NMR experiments • One-dimensional NMR experiments, such as 1H, 13C and DEPT, yield the following important information: chemical shifts (high resolution), spin-spin coupling and integration. • The 1-D NMR experiment is the basis for designing other 1-D and 2-D experiments. Despite the popularity of 2-D NMR experiments, the importance of high quality 1-D experiments should not be underestimated!
The basic single-pulse 1-D NMR experiment is made up of the following components: preparation, pulse (tPW), acquisition time (AQT), delay time (tD): n • The main experimental variables which are normally manipulated are: • pulse width • pulse amplitude • acquisition time (resolution) • pulse delay • number of acquisitions (repeats).
4-Basic 1-D NMR (Dayrit) 90°- pulse
4-Basic 1-D NMR (Dayrit) Pulse Angle, • The pulse angle, , is the actual angular displacement of the macroscopic magnetization vector. It is determined by the setting of the pulse width, tPW, and the pulse power (amplitude), B1: = B1tPW • The pulse amplitude is usually set so that the pulse width is as short as possible, usually in the range of a few s. • An accurate determination of the pulse widths for 90 and 180 pulses is essential for many NMR experiments. This also varies with the condition of the instrument (e.g., tune, homogeneity) and sample (e.g., solvent, size of NMR tube).
4-Basic 1-D NMR (Dayrit) The Ernst angle, E • Although the 90-pulse yields the maximum NMR signal for a single accumulation, experiments which require multiple accumulations use smaller pulse angles, because of the long time delay required, tD, for the magnetization to return to its equilibrium value, which is about 5 times T1. • If the cycle time is too short, the magnetization will not fully recover and saturation will occur with consequent loss of signal. • For multiple accumulation, it is preferable to pulse with an angle which maximizes the steady-state z'-magnetization. This angle is called the Ernst angle, E: • cos E = exp (-tD / T1)
4-Basic 1-D NMR (Dayrit) Plot of the fractional intensity of a resonance obtained in a repetitive pulse experiment as a function of (tD / T1) for different Ernst angles. (from: Shaw, Fourier Transform NMR Spectroscopy.) cos E = exp (-tD / T1) td 1H, sec 13C, sec E 1/10T1 0.2 6 34 ¼T1 0.5 15 53 ½T1 1.0 30 71 T1 2.0 60 76 (tD shorter than T1) (tD longer than T1) (tD = T1)
4-Basic 1-D NMR (Dayrit) The Ernst angle, E cosE = exp (-tD / T1) • For 1H nuclei which have T1 values of up to a few seconds, a tD of about 2 seconds gives an optimum pulse angle of about 70°. • For 13C nuclei, the range of T1 values varies from a few seconds to over 60 s. In order to observe all 13C nuclei, we use the longer T1 value. Therefore, assuming a T1 value of 60 seconds and a tD of about 2 seconds, we obtain an Ernst angle of only about 15°.
4-Basic 1-D NMR (Dayrit) Phase Error • A perfectly phased peak is possible only if the pulse is set directly on top of the resonance frequency (on-resonance). Obviously, this condition can only hold at best for one peak. Phase errors arise from the rotation of the off-resonance vectors away from the +y axisduring the pulse. On resonance Dn
4-Basic 1-D NMR (Dayrit) Phase Error • The phase error depends on the frequency difference, , between the position of the pulse and the chemical shift of the nucleus, as well as the pulse width, tPW: = 2tPW • Since the on-resonance condition can only be true for one position in the spectrum, this means that phase errors are inevitable in pulse NMR. • Phase error affects the accuracy of integration.
4-Basic 1-D NMR (Dayrit) Data processing • The NMR data (FIDs) are collected during acquisition. The acquisition parameters determine the quality of the information. • Data processing in NMR is an important step which enables one to emphasize various aspects of the data, such as: • signal-to-noise • resolution enhancement • relative weights of portions of the FID • Two of the most common manipulations are zero-filling and exponential multiplication. • Zero-filling increases spectral resolution • Exponential multiplication increases the signal-to-noise
4-Basic 1-D NMR (Dayrit) Zero filling and spectral resolution • The acquisition time of the FID influences the spectral resolution. For example, if one collects the FID for 2 seconds, one obtains a theoretical resolution of 1/(2 sec) = 0.5 Hz. • For a typical 1H FID, the signal decays to zero within about two seconds. Most of the signal appears during the early part of the FID and what remains at the tail end is mostly noise. Therefore, it is counter-productive to collect the FID for a long time since one will only record more noise. To minimize this problem, one sets the acquisition time to less than one second, and then zero-fills the FID, literally adding zeros onto the data before FT processing. The theoretical resolution can be “improved” by a factor of 2.
4-Basic 1-D NMR (Dayrit) Zero-filling improves the spectral resolution by adding extra data points (zeros) to the FID without introducing noise. The increased time domain of the FID increases the spectral resolution. (from: Derome, Modern NMR Techniques for Chemistry Research.)
4-Basic 1-D NMR (Dayrit) Exponential multiplication (EM) of the FID accentuates the early portion of the FID where the signals from the sample are dominant and de-emphasizes the latter portion of the FID where the relative amount of noise is higher. This improves the signal-to-noise of the spectrum. (a) Original FID and NMR signal; (b) EM of FID and resulting NMR signal. (from: Sanders and Hunter, Modern NMR Spectroscopy.) FT FT
4-Basic 1-D NMR (Dayrit) T2, exponential multiplication gives a Lorentzian lineshape
Lorentzian Line Shape The NMR line shape is ideally Lorentzian because of the exponential decay function: f(t) = E0exp (-t/T2) On the other hand, molecules in a real sample experience different environments due to solvation, matrix effects or magnetic inhomogeneities, which result in a Gaussian peak. This reflects the distribution of the relaxation times which gives rise to a distribution of energies (and therefore a distribution of frequencies in the observed spectrum). Comparison between normalized Lorentzian (solid) and Gaussian (dashed) distributions. Note that the area under both curves is 1.
09-NMR Instrumentation (Dayrit) NMR parameters that affect resolution and sensitivity.
4-Basic 1-D NMR (Dayrit) • S/N, Signal Averaging • The signal-to-noise ratio (S/N) is generally defined as the ratio between the intensity of the signal of interest to the noise of the baseline ((+)-peak to (-)-peak). Because NMR signals are inherently weak, good S/N is an important objective. Noise can be minimized by: • Decreasing electronic noise: better electronics and probe design • Good tuning and shimming • NMR improves S/N by repetitive accumulation which increases the signal in direct proportion to the number of accumulations (improvement by n times) but increases the noise only by n. Thus the S/N increases by an overall factor of n. For example: • To improve S/N by two times: 2 = n; n = 4 times. • To improve the S/N of a 1,000 scan run by a factor of 2, you need the following number of scans: 4 x 1,000 = 4,000 scans.
4-Basic 1-D NMR (Dayrit) The ethylbenzene test for proton sensitivity and S/N. The height of the central lines of the quartet at 2.7 is compared with a sample of noise. This spectrum gives S = 270:1. S is calculated as: S = 2.5 x A/Npp, where A is the height of the selected peak and Npp is the peak-to-peak deflection of the baseline noise. (from: Derome, Modern NMR Techniques for Chemistry Research.)
4-Basic 1-D NMR (Dayrit) • Dynamic Range and Sample Amount • The dynamic range defines the ability of the computer digitizer to convert the amplitude of the analogue FID signal into a binary representation. The higher the dynamic range, the better the ability of the instrument to detect a small signal above the noise (or a shoulder beside a large peak). This problem occurs in dilute aqueous solutions where the water peak is very strong. Modern NMR instruments are equipped with digitizers which are 16-bit or higher. A 16-bit digitizer can represent a signal 0.0015% of the largest peak ( = 1/216). • A related phenomenon occurs if the amount of sample is too small. But when the S/N < 3, the weak signals cannot be detected even with additional accumulation and signal averaging.
4-Basic 1-D NMR (Dayrit) Sample size 50 mg 5 mg 0.5 mg Peak signals which are of the same magnitude as, or below, the noise level will not be detected even with repeated accumulation. (from: Derome, Modern NMR Techniques for Chemistry Research)
4-Basic 1-D NMR (Dayrit) • Summary • Following are some important points to consider when taking a 1-dimensional NMR measurement: • Optimize shims • Recognizing and minimizing phase errors • Setting proper spectral width and number of sample points • Zero-filling and exponential multiplication • Effect of dynamic range • Effect of sample size.