Download
1 / 39
390 likes | 405 Views
Join our webinar series to learn about national initiatives, educational environments data, survey results on preschool inclusion, and key resources supporting the inclusion of young children with disabilities.

E N D
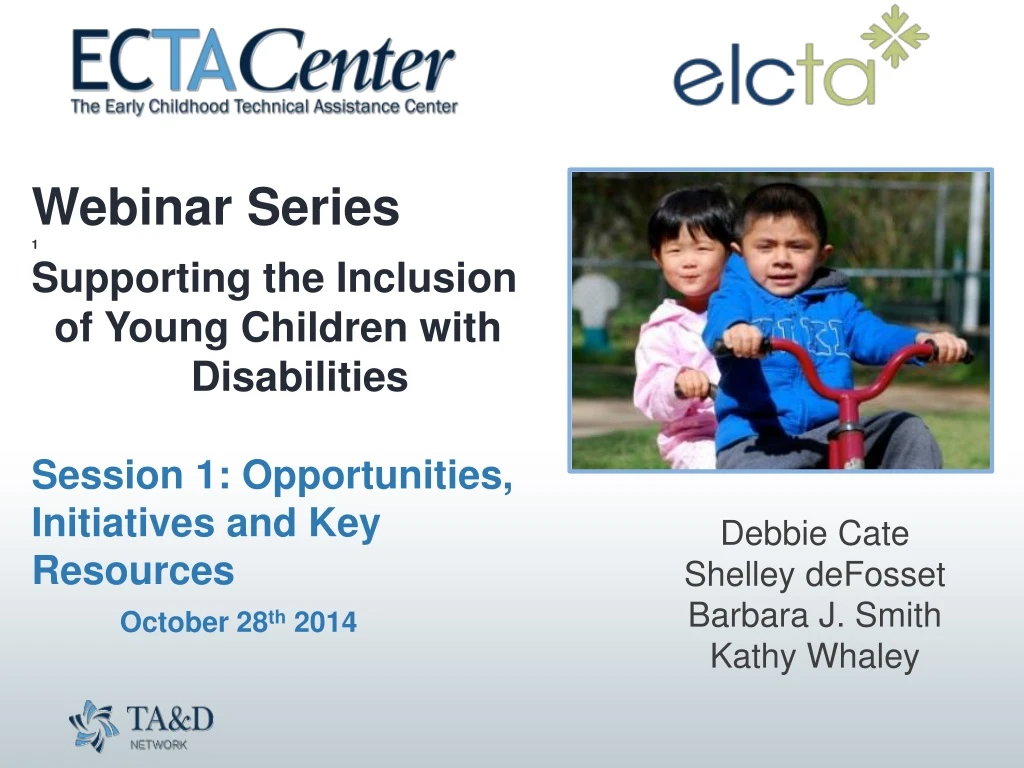
Webinar Series1Supporting the Inclusion of Young Children with DisabilitiesSession 1: Opportunities, Initiatives and Key ResourcesOctober 28th 2014 Debbie Cate Shelley deFosset Barbara J. Smith Kathy Whaley
Objectives Share information about: • National initiatives supporting inclusion, • National educational environments data, • National survey results on preschool inclusion, and • Resources and materials supporting inclusion, including future webinars.
National Initiatives and Opportunities in Support of Inclusion • Federal Public Awareness Campaign with a Position Paper on Inclusion • DEC Special Initiative on Inclusion • RTT-ELC and Pre-School Development Grants • ECTA/ ELC TA Partnership
State practices integrating IDEA programs into TQRIS/QRIS • Strengthening agency partnerships for a coordinated approach to serving children with disabilities The Inclusion Forum provided an opportunityfor discussion and problem solving:
Priorities Selected by Participants • Defining and measuring quality indicators for Part B/619 and Part C • Incorporating incentives for school-based early childhood programs in TQRIS/QRIS • Incorporating incentives for other early childhood programs in TQRIS/QRIS
Priorities, continued • Providing professional development and technical assistance to support inclusive practice • Developing cross-sector professional development to ensure staff are adequately prepared • Using data to inform decisions (at all levels) about professional development, resources, administration, policies, and program practices.
SPP APR Indicator 6 Measurement: • Percent of children aged 3 - 5 with IEPs attending a regular early childhood program and receiving the majority of special education and related services in the regular early childhood program. • Percent of children aged 3 - 5 with IEPs attending a separate special education class, separate school or residential facility.
Indicator Results 2012-2013 Data reported for IDEA 2012 Educational Environments
2012-13: Percent of Children Attending: Regular EC Program Special Education 42% 26% Special education class, separate school, or residential facility And receiving the majority of special education in the program
6A: Percent of children with IEPs attending a regular early childhood program (RECP) and receiving the majority of services in the program Each diamond represents a state or territory, SPP/APR SY 2012-2013
Indicator 6B: Percent of children with IEPsattending a special education program Each diamond represents a state or territory, SPP/APR SY 2012-2013
B6 Data Reporting Tools Tools from the IDEA Data Center: Excerpts from the Technical Guide – Children with Disabilities (IDEA) Early Childhood File Specifications https://www.ideadata.org/tools-products Source: EDFacts, File CO89
B6 Data Reporting Tools Decision Tree and Measurement Table debbie.cate@unc.edu
The last national look at challenges and solutions was conducted almost 25 years ago(Smith, Salisbury & Rose, 1992) Preschool Inclusion Survey (Barton & Smith, 2014)
The Facts • Inclusion benefits all children • Children can be effectively educated in inclusive programs using specialized instruction • Families of all children generally have positive views of inclusion • Inclusion is not more expensive • Children do not need to be “ready”
TheFacts • Research is clear: it’s effective • IDEA is clear: it’s preferred • The profession is clear: DEC/NAEYC position statement
And Yet In 27 years inclusion has increased only 5.7% And many children continue to be educated in separate settings. • Source: OSEP annual reports: 1987 (1984-85 data); 2014 (2012 data)
The Survey • Preschool inclusion definition: when children (age 3 – 5) with Individual Education Programs (IEP) receive their special education and related services in settings with at least 50% of peers without IEPs • January 2014 • Electronic survey to 619 Coordinators; asked that they send to others • Asked what are the challenges and solutions
The Survey Respondents 238 people responded - from 32 states and 1 territory
Overall Challenges • Attitudes & Beliefs • Fiscal & contracting • Approval of non-public school setting • Curricula/methods • Transportation • Personnel qualifications • Conflicting policies • Program quality
Survey Results: Challenges • Attitudes & Beliefs 30% • Fiscal & contracting 19% • Approval of non-public school setting 16% • Curricula/methods 15% • Transportation 15% • Personnel qualifications 11% • Conflicting policies 10% • Program quality 10%
3 Categories of Challenges • Attitudes & Beliefs • Policies/Procedures • Resources
Attitude & Belief Challenges • Lack of Communication/collaboration • Lack of awareness/understanding • “Someone will lose” Beliefs • Staff preparedness • Turf issues • Lack of respect • Other
Attitude & Belief Challenges • Lack of Communication/collaboration (20%) • “Someone will lose” Beliefs (20%) • Staff preparedness (17%) • Lack of awareness/understanding (16%) • Turf issues (14%) • Lack of respect (12%) • Other (1%)
Policy/Procedures Challenges • 19 of 70 maybe policy • Most local, then state, then federal • Categories of policy/procedure challenges: • Ensuring quality (standards, curricula, practices) in inclusive settings • Ensuring personnel meet standards and are effective • Fiscal policies/procedures (contracting; $ streams) • Transportation policies/procedures
Resource Challenges • Community programs full; no available slots • Lack of resources for transportation for typically developing children • Lack of resources for itinerate services
Attitude & Belief Solutions/Strategies Two categories • Collaboration across regular EC and ECSE personnel; between district and community programs • Building awareness/support
A/B: Build Awareness/Support • Educate local administrators • Provide user-friendly materials on benefits & laws • Provide models of high quality inclusion where teachers, parents and administrators can visit • Provide opportunities for practitioners, administrators and families to explore concerns, benefits and possible solutions
A/B: Collaborate • Establish trans-disciplinary teams • Establish interagency inclusion team • Provide awareness materials and opportunities for administrators • Provide joint PD for district and community personnel • Ensure support to community programs for ECSE and behavior support • Build culture of collaborative problem solving
Policy/Procedure Solutions/Strategies • Ensure state funded pre-k, at-risk & Title I programs are inclusive • Require co-teaching (EC & ECSE) practica for certification • Provide training and coaching to community programs & itinerate ECSE services • Provide state training and T/A to district and community EC programs • Create MOU’s and contracts with community programs that address quality
Policy/Procedure Solutions/Strategies • Provide paras to community sites • Create tuition based access to district EC programs for nondisabled children • Reimburse parents for transportation • Create a state-level inclusion team for “barrier busting” that responds to local concerns • State dissemination to districts of creative ways to provide inclusion; examples; incentives • Braid funding streams
Resource Solutions/Strategies • Inclusive services do not cost more than segregated • Braid resources • Collaborate • Redistribute (itinerate/consultative vs. segregated) • Public awareness of the benefits=$$
New LRE Resources
Hope to see you there! http://inclusioninstitute.fpg.unc.edu/
Thank you for your attention! Resources related to this webinar and other presentations are available at the following URL: http://ectacenter.org/webinars.asp