Download
1 / 34
340 likes | 361 Views
This presentation covers the concept and applications of Support Vector Machines (SVM) in data mining, focusing on its principal contributions, including Lagrangian SVM classification, fast iterative methods, and incorporating expert knowledge. It discusses the algebra of linearly separable cases, compares Standard SVM with Proximal SVM, and details numerical experiments on large datasets to demonstrate the efficiency and accuracy of SVM algorithms. Additionally, it outlines the incorporation of knowledge sets into SVM classification and presents testing results on datasets like Promoter Recognition and Wisconsin Breast Cancer Prognosis.

E N D
Support Vector Machines in Data MiningAFOSR Software & Systems Annual Meeting Syracuse, NY June 3-7, 2002 Olvi L. Mangasarian Data Mining Institute University of Wisconsin - Madison
What is a Support Vector Machine? • An optimally defined surface • Linear or nonlinear in the input space • Linear in a higher dimensional feature space • Implicitly defined by a kernel function
What are Support Vector Machines Used For? • Classification • Regression & Data Fitting • Supervised & Unsupervised Learning
Principal Contributions • Lagrangian support vector machine classification • Fast, simple, unconstrained iterative method • Reduced support vector machine classification • Accurate nonlinear classifier using random sampling • Proximal support vector machine classification • Classify by proximity to planes instead of halfspaces • Massive incremental classification • Classify by retiring old data & adding new data • Knowledge-based classification • Incorporate expert knowledge into classifier • Fast Newton method classifier • Finitely terminating fast algorithm for classification • Breast cancer prognosis & chemotherapy • Classify patients on basis of distinct survival curves
Principal Contributions • Proximal support vector machine classification
Support Vector MachinesMaximize the Margin between Bounding Planes A+ A-
Proximal Support Vector Machines Maximize the Margin between Proximal Planes A+ A-
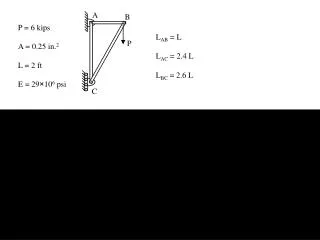
Given m points in n dimensional space • Represented by an m-by-n matrix A • Membership of each in class +1 or –1 specified by: • An m-by-m diagonal matrix D with +1 & -1 entries • Separate by two bounding planes, • More succinctly: where e is a vector of ones. Standard Support Vector MachineAlgebra of 2-Category Linearly Separable Case
Solve the quadratic program for some : min (QP) , s. t. where , denotes or membership. • Marginis maximized by minimizing Standard Support Vector Machine Formulation
min (QP) s. t. Solving for in terms of and gives: min PSVM Formulation Standard SVM formulation: This simple, but critical modification, changes the nature of the optimization problem tremendously!!
Advantages of New Formulation • Objective function remains strongly convex. • An explicit exact solution can be written in terms of the problem data. • PSVM classifier is obtained by solving a single system of linear equations in the usually small dimensional input space. • Exact leave-one-out-correctness can be obtained in terms of problem data.
We want to solve: min Linear PSVM • Setting the gradient equal to zero, gives a nonsingular system of linear equations. • Solution of the system gives the desired PSVM classifier.
Here, • The linear system to solve depends on: which is of size is usually much smaller than Linear PSVM Solution
Linear & Nonlinear PSVM MATLAB Code function [w, gamma] = psvm(A,d,nu)% PSVM: linear and nonlinear classification % INPUT: A, d=diag(D), nu. OUTPUT: w, gamma% [w, gamma] = psvm(A,d,nu); [m,n]=size(A);e=ones(m,1);H=[A -e]; v=(d’*H)’ %v=H’*D*e; r=(speye(n+1)/nu+H’*H)\v % solve (I/nu+H’*H)r=v w=r(1:n);gamma=r(n+1); % getting w,gamma from r
Numerical experimentsOne-Billion Two-Class Dataset • Synthetic dataset consisting of 1 billion points in 10- dimensional input space • Generated by NDC (Normally Distributed Clustered) dataset generator • Dataset divided into 500 blocks of 2 million points each. • Solution obtained in less than 2 hours and 26 minutes • About 30% of the time was spent reading data from disk. • Testing set Correctness 90.79%
Principal Contributions • Knowledge-based classification
Suppose that the knowledge set: belongs to the class A+. Hence it must lie in the halfspace : • We therefore have the implication: Incoporating Knowledge Sets Into an SVM Classifier • This implication is equivalent to a set of constraints that can be imposed on the classification problem.
Numerical TestingThe Promoter Recognition Dataset • Promoter: Short DNA sequence that precedes a gene sequence. • A promoter consists of 57 consecutive DNA nucleotides belonging to {A,G,C,T} . • Important to distinguish between promoters and nonpromoters • This distinction identifies starting locations of genes in long uncharacterizedDNA sequences.
Wisconsin Breast Cancer Prognosis Dataset Description of the data • 110 instances corresponding to 41 patients whose cancer had recurred and 69 patients whose cancer had not recurred • 32 numerical features • The domain theory: two simple rules used by doctors:
Wisconsin Breast Cancer Prognosis Dataset Numerical Testing Results • Doctor’s rules applicable to only 32 out of 110 patients. • Only 22 of 32 patients are classified correctly by this rule (20% Correctness). • KSVM linear classifier applicable to allpatients with correctness of 66.4%. • Correctness comparable to best available results using conventional SVMs. • KSVM can get classifiers based on knowledge without using any data.
Principal Contributions • Fast Newton method classifier
Fast Newton Algorithm for Classification Standard quadratic programming (QP) formulation of SVM:
Newton Algorithm • Newton algorithm terminates in a finite number of steps • Termination at global minimum • Error rate decreases linearly • Can generate complex nonlinear classifiers • By using nonlinear kernels: K(x,y)
Principal Contributions • Breast cancer prognosis & chemotherapy
Kaplan-Meier Curves for Overall Patients:With & Without Chemotherapy
Breast Cancer Prognosis & ChemotherapyGood, Intermediate & Poor Patient Clustering
Kaplan-Meier Survival Curvesfor Good, Intermediate & Poor Patients
Kaplan-Meier Survival Curves for Intermediate Group: With & Without Chemotherapy
Conclusion • New methods for classification proposed • All based on rigorous mathematical foundation • Fast computational algorithms capable of classifying massive datasets • Classifiers based on both abstract prior knowledge as well as conventional datasets • Identification of breast cancer patients that can benefit from chemotherapy
Future Work • Extend proposed methods to standard optimization problems • Linear & quadratic programming • Preleminary results beat state-of-the-art software • Incorporate abstract concepts into optimization problems as constraints • Develop fast online algorithms for intrusion and fraud detection • Classify the effectiveness of new drug cocktails in combating various forms of cancer • Encouraging preliminary results