Download
1 / 23
230 likes | 244 Views
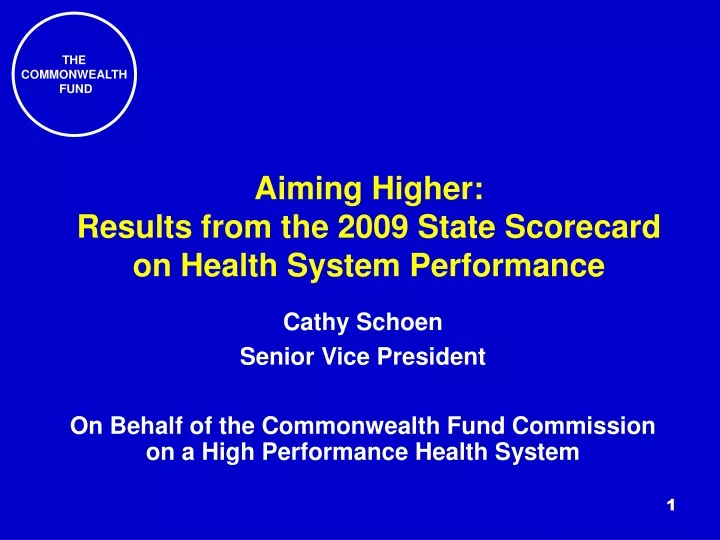
Aiming Higher: Results from the 2009 State Scorecard on Health System Performance. Cathy Schoen Senior Vice President On Behalf of the Commonwealth Fund Commission on a High Performance Health System. 2009 State Scorecard: Key Findings. Wide variation across states: where you live matters

E N D
Aiming Higher: Results from the 2009 State Scorecard on Health System Performance Cathy Schoen Senior Vice President On Behalf of the Commonwealth Fund Commission on a High Performance Health System
2009 State Scorecard: Key Findings • Wide variation across states: where you live matters • Top states continue to lead; set new benchmarks • Two- to three-fold spread between top and bottom states • Losing ground on coverage: federal action key • Rising rates of uninsured adults • Coverage held steady or improved for children • Large gains follow national efforts to measure and publicly report performance • Hospital and nursing home/home health quality indicators improved substantially • Preventive care and coordination failed to improve • Opportunities to improve both quality and costs • Negative trends on hospital readmissions • Highest readmission rates in highest cost states • Affordability is growing concern: costs rising faster than incomes
2009 State Scorecard Summary of Health System Performance SOURCE: Commonwealth Fund State Scorecard on Health System Performance, 2009
ACCESS State Ranking on Access Dimension SOURCE: Commonwealth Fund State Scorecard on Health System Performance, 2009
ACCESS: PARTICIPATION 1999–2000 2007–2008 NH ME WA NH VT ME WA VT ND MT ND MT MN MN OR NY MA WI OR MA NY ID SD WI RI MI ID SD RI WY MI CT PA WY NJ CT IA PA NJ NE IA OH DE IN NE OH NV DE IN IL MD NV WV UT VA IL MD CO DC WV UT VA KS MO KY CA CO DC KS MO KY CA NC NC TN TN OK SC AR OK AZ NM SC AR AZ NM MS GA AL MS GA AL TX LA TX LA FL FL AK AK 23% or more HI HI 19%–22.9% 14%–18.9% Less than 14% Percent of Adults Ages 18–64 Uninsured by State Data: U.S. Census Bureau, 2000–01 and 2008–09 Current Population Survey ASEC Supplement SOURCE: Commonwealth Fund State Scorecard on Health System Performance, 2009
ACCESS: PARTICIPATION 1999–2000 2007–2008 NH ME WA NH VT ME WA VT ND MT ND MT MN MN OR NY MA WI OR MA NY ID SD WI RI MI ID SD RI WY MI CT PA WY NJ CT IA PA NJ NE IA OH DE IN NE OH NV DE IN IL MD NV WV UT VA IL MD CO DC WV UT VA KS MO KY CA CO DC KS MO KY CA NC NC TN TN OK SC AR OK AZ NM SC AR AZ NM MS GA AL MS GA AL TX LA TX LA FL FL AK AK 16% or more HI HI 10%–15.9% 7%–9.9% Less than 7% Percent of Children Ages 0–17 Uninsured by State Data: U.S. Census Bureau, 2000–01 and 2008–09 Current Population Survey ASEC Supplement SOURCE: Commonwealth Fund State Scorecard on Health System Performance, 2009
Access and Quality Are Related ACCESS SOURCE: Commonwealth Fund State Scorecard on Health System Performance, 2009
PREVENTION & TREATMENT State Ranking on Prevention and Treatment Dimension SOURCE: Commonwealth Fund State Scorecard on Health System Performance, 2009
PREVENTION & TREATMENT: EFFECTIVE & PATIENT-CENTERED CARE Hospital and Nursing Home Quality Improved Across States Data: Hospital/surgical―2004 and 2007 CMS Hospital Compare; Home health―2005 and 2007 OASIS; Nursing home― 2004 and 2007 MDS SOURCE: Commonwealth Fund State Scorecard on Health System Performance, 2009
PREVENTION & TREATMENT: EFFECTIVE CARE State Variation: Prevention of Surgical Complications Percent of adult surgical patients who received appropriate care to prevent complications* * Data for 2004 is a composite of two clinical indicators; 2007 is a composite of five clinical indicators consisting of original two in 2004 and three new indicators. See Appendix B for description of clinical indicators. DATA: 2004 and 2007 CMS Hospital Compare SOURCE: Commonwealth Fund State Scorecard on Health System Performance, 2009
PREVENTION & TREATMENT: EFFECTIVE CARE State Variation: Ambulatory Care Quality Indicators Percent DATA: Adult preventive care—2006 BRFSS; Adult diabetic preventive care—2006–07 BRFSS; Child vaccines—2007 National Immunization Survey; Child medical and dental visits—2007 National Survey of Children’s Health SOURCE: Commonwealth Fund State Scorecard on Health System Performance, 2009
EQUITY Lack of Recommended Preventive Care by Income and Insurance Percent of adults age 50+ who did not receive recommended preventive care By income By insurance U.S. overall average = 58 Note: Top 5 states refer to states with smallest gaps between U.S. overall average and low-income/uninsured groups. Bottom 5 states refer to states with largest gaps between U.S. overall average and low-income/uninsured groups. DATA: 2006 BRFSS SOURCE: Commonwealth Fund State Scorecard on Health System Performance, 2009
EQUITY Children Without a Medical Home by Income and Insurance Percent of children without a medical home By income By insurance U.S. overall average = 43 Note: Top 5 states refer to states with smallest gaps between U.S. overall average and low-income/uninsured groups. Bottom 5 states refer to states with largest gaps between U.S. overall average and low-income/uninsured groups. DATA: 2007 National Survey of Children’s Health SOURCE: Commonwealth Fund State Scorecard on Health System Performance, 2009
AVOIDABLE HOSPITAL USE & COSTS State Ranking on Potentially Avoidable Use of Hospitals and Costs of Care Dimension SOURCE: Commonwealth Fund State Scorecard on Health System Performance, 2009
AVOIDABLE HOSPITAL USE & COSTS State Variation: Hospital Admissions Indicators Percent DATA: Medicare readmissions—2006–07 Medicare 5% SAF Data; Nursing home admission and readmissions—2006 Medicare enrollment records and MEDPAR file; Home health admissions—2007 Outcome and Assessment Information Set SOURCE: Commonwealth Fund State Scorecard on Health System Performance, 2009
Medicare Cost Per Beneficiary and 30-Day Readmissions by State AVOIDABLE HOSPITAL USE & COSTS DATA: Medicare readmissions—2006–07 Medicare 5% SAF Data; Medicare reimbursement—2006 Dartmouth Atlas of Health Care SOURCE: Commonwealth Fund State Scorecard on Health System Performance, 2009
AVOIDABLE HOSPITAL USE & COSTS Average Employer Premiums as Percentage of Median Household Income for Under-65 Population, Distribution by State, 2003 and 2008 Number of states with premiums amounting to following percentages of income DATA: Average premiums for employer-based health insurance plans (weighted by single and family household distribution)—2003 and 2008 Medical Expenditure Survey; Median household incomes for under-65 population—2004–05 and 2008 Current Population Survey ASEC Supplement (representing 2003–04 and 2007 data). SOURCE: Commonwealth Fund State Scorecard on Health System Performance, 2009
Healthy Lives State Ranking on Healthy Lives Dimension SOURCE: Commonwealth Fund State Scorecard on Health System Performance, 2009
Healthy Lives Mortality Amenable to Health Care by StateDeaths* per 100,000 Population 2004–05 NH ME WA VT ND MT MN OR MA NY WI ID SD MI RI WY CT PA NJ IA NE OH DE IN NV IL MD WV UT VA CO DC KS MO KY CA NC TN OK SC AR AZ NM MS GA AL TX LA FL AK Quartile (range) HI Top (63.9–76.8) Best: MN Second (77.2–89.9) Third (90.7–107.5) Bottom (108.0–158.3) Worst: DC * Age-standardized deaths before age 75 from select causes; includes ischemic heart disease. ** Excludes District of Columbia. DATA: Analysis of 2001–02 and 2004–05 CDC Multiple Cause-of-Death data files using Nolte and McKee methodology, BMJ 2003 SOURCE: Commonwealth Fund State Scorecard on Health System Performance, 2009
Gains to Nation if All States Achieved Top State Performance • More people covered: 29 million additional adults and children insured; uninsured rates cut more than half • More getting recommended preventive care: • 9 million additional adults (age 50+) and nearly 4 million diabetics received recommended care • 800,000 children immunized • More getting primary care: 30 million adults and children would have a usual source of primary care • Less avoidable hospital utilization: 1 million fewer Medicare hospital admissions and readmissions per year; potential savings of $5 billion a year • Healthier lives: 78,000 fewer premature deaths SOURCE: Commonwealth Fund State Scorecard on Health System Performance, 2009
Aiming Higher: Policy Implications • Federal action needed to raise floor of performance • Coverage and affordability • National information/transparency make a difference • Payment reform to reward and support value • Leading states emphasize access and promote quality with a culture of collaboration Urgent need for federal AND state action that takes a whole-system population perspective and addresses access, quality and cost/efficiency • Target primary care, prevention and health • Care systems that integrate and coordinate care • All states have opportunities to improve
State Health System Scorecard Methods • Objective: to stimulate discussion and inform national and state policy action • Framework modeled on National Scorecard • 5 dimensions: access; prevention & treatment; avoidable hospital use & costs; equity; and healthy lives • Provides achievable benchmarks for improvement • Ranks states over two time periods • Updates set of 38 indicators (6 new); 35 have trend data • Dimension rank = average of indicator ranks • Overall rank = average of 5 dimension ranks • Equity measures gaps between vulnerable groups (low-income, uninsured, and non-white) and U.S. average on subset of indicators
AcknowledgmentsThe Commonwealth Fund and Rutgers University Coauthors Sabrina How, MPA Senior Research Associate, Commonwealth Fund Douglas McCarthy, MBA Senior Research Advisor, Commonwealth Fund Dina Belloff, MA Senior Research Analyst, Rutgers University Center for State Health Policy Joel C. Cantor, ScD Director, Rutgers University Center for State Health Policy