Download
1 / 69
690 likes | 852 Views
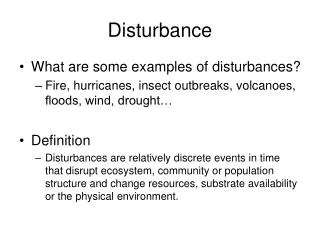
Disturbance Monitoring Working Group (DMWG) Report to TSS August 15-17, 2007. Disturbance Monitoring Working Group August 15-17, 2007. WECC DMWG Activities. WECC Funding for approved sites Hardware Software Maintenance Networked PDC sites Disturbance data requests

E N D
Disturbance Monitoring Working Group (DMWG)Report to TSSAugust 15-17, 2007 Disturbance Monitoring Working Group August 15-17, 2007
WECC DMWG Activities • WECC Funding for approved sites • Hardware • Software • Maintenance • Networked PDC sites • Disturbance data requests • WECC Data website • Guidelines to initiate a data request • DFR/SER Survey – list • NERC Disturbance Monitoring standards & compliance • Generator Performance Monitor • Event reporting
Other Related Activities • DC Probe Tests • Brake tests • Event analysis & reports • SCE Power System Outlook & SMART programs • CERTS/CEC/ California ISO projects • Load Models & Validation • Wind Generator Models validation • BPA Initiative to use signals for stability control, increase inter-tie rating Wide- Area stability and voltage Control System (WACS)
WECC Disturbance Monitoring Working GroupMonitor Installation Status(WECC Funded)
Phasor Data Concentrators Presently Installed in WECC BCH PDC BPA PDC WAPA PDC PGEPDC CAISO PDC APSPDC PNMPDC SCE PDC
BCH ALBERTA WAPA BPA CA ISO PG&E LADWP APS PNM SCE Black and yellow, already exists Orange, desirable in the future Desirable Communication System for Inter-Utility Data Exchange
WECC Disturbance Monitoring Working GroupGenerator Performance Monitor RFP • Responses were due February 23, 2007. • Three bids received (Maxisys, Macrodyne, and NxtPhase) • All responsive • All within budget • Bid evaluation meeting on March 1, 2007 • Requested clarification from one bidder • Determined that slightly reduced requirements would still be acceptable • Awarded P.O. to NxtPhase based on price and proven availability of the equipment • Expect delivery by October 2007
Generator Performance GE PSLF Simulations Compare Recorded and Simulated Power: MW and MVAR Inject Recorded Voltage and Frequency ~ Disturbance “playback” is a standard feature in PSLF-16
Disturbance Monitoring Working Group WECC Web Server • WECC ftp site and web server are now available • We had been using BPA servers for storing data • The next data request will be able to utilize the WECC site • Need to store data for significant events • Access to DMWG members to be provided for • Uploading data • Down loading files for their analysis • Conducting analysis – PNNL / Others • For viewing event analysis reports
WECC Disturbance Monitoring Working Group PMU Maintenance Agreement Extension • Creation of a continuing maintenance reimbursement program • Annual agreement • $2750 / year / monitor • Host agrees to provide data upon request • Can be renewed by agreement of both parties • Only for monitors with expired WECC/Host Agreements • Maintenance Agreement Extension Approved by DMWG on April 19 • MOTION Recommended to PCC: The DMWG requests that PCC recommend to the Board of Directors that, subject to WECC legal review, the pro-forma WECC/Host Maintenance Agreement be approved. • This has been approved
WECC Disturbance Monitoring Working GroupDisturbance Monitor Data Requests • The DMWG evaluates and requests data from the funded PMUs • Some of the disturbance events that were evaluated • April 10 and 11 Colstrip disturbances • May 7 Loss of 500 kV Round Mountain-Table Mountain #2; CJB • May 9 Loss of 500 kV Summer Lake-Malin #1; CJB • May 23 500 kV Big Eddy fault; NW Gen Drop 2321 MW; CJB
WECC Disturbance Monitoring Working GroupDisturbance Monitor Data Requests • DMWG will be evaluating data request criterion • for storing data on the website. • The suggested criterion to store data on the WECC website is: • with more than 0.2 Hz frequency deviation • CJ Brake application ( There is an opportunity to learn) • Greater than 1800 MW generation / load drop • PDCI Power block of greater than 2000 MW
WECC Disturbance Monitoring Working GroupDisturbance Reports from SCE • SCE sends out event info of significant events from its PSO program to MVWG, DMWG, TSS Members & some NERC Staff, whenever • Greater than 700 MW generation loss occurs • Greater than 0.1 Hz frequency deviation • These files have only the SCE data + BPA • Grand Coulee data
WECC Disturbance Monitoring Working Group SCE Disturbance Reports • SCE Power System Outlook files have following information: • Frequency plot • Voltage magnitude plots • Voltage phase angle plots • Voltage deviation plots • Path 26 (Midway-Vincent total power flows) • Modal oscillations analysis at Vincent on Path 26 • FFT plot of power flows at Vincent substation • Any other important or unusual information
WECC Disturbance Monitoring Working Group List of 2007 events for which files have been sent • Date Time Freq. Event Description • (PDT) dropped • to • 011507-1 1430 59.92 770 MW of Generation trip at Four Corners • 012307-1 1344 59.76 2935 MW Gen drop – BC Hydro • 020107-1 1116 59.88 1750 MW Gen. loss • 020707-1 0058 59.88 1340 MW Palo Verde unit trip • 032207-1 1510 59.40 SRP lost 750 MW • 032207-1 1639 59.92 SRP lost 750 MW • 041007-1 0846 59.83 Colstrip gen. trip • 041107-1 1518 59.79 Colstrip gen. trip • 052307-1 1808 59.74 Big Eddy Trans. Trip, 2321 MW drop; CJB • 062007-1 1359 59.93 MPC NEW Gen trip – 740 MW • 062007-2 1547 59.89 SRP Gen drop - 750 MW • 062007-3 2251 59.89 SCE – SONGS Gen drop – 1080 MW • 062107-1 1111 59.91 NEW Gen drop – 740 MW • 062207-1 1448 59.91 PNSC – Gen drop – 717 MW • 071207-1 1639 59.88 BCTC -1217 MW Gen drop • 071807-1 0643 59.84 BPA 1442 Gen drop; CJB • 071907-1 1414 59.90 LA DWP Gen drop – 950 MW (IPP) • 080207-1 1332 59.92 MPC lost 740 MW Generation
Disturbance Monitoring Working GroupOther Important Issues for Face to face meeting • Face to face meeting – October 24/25/26, 2007. • Review of on-going activities • NERC PRC 002 and PRC 018 standards • Workshop for data viewing and analysis • Training - Tools for analysis and viewing • SCE would host this meeting • Suggestions are invited – please send them to • Donald and Bharat • Data interchange among WECC Utiilities • Bi-lateral agreements between Utilities • Data transfer to WECC • Super PDC / Central PDC data storage • Communication links • Communication Network • Data analysis / Analysis of recorded events • Development of data collection trigger • Review of some past significant events • White paper – Benefits of Power System Monitoring
NERC Disturbance Monitoring Standards Development Info from meeting held on August 7-9, 2007 West Palm Beach, Florida
NERC Disturbance Monitoring Standards Drafting Team Meeting August 7-9, 2007 • NERC had great difficulty in collecting August 14, 2003 disturbance data required for analysis • New standards are being written to simplify data collection • The primary source of disturbance data collection is considered to be Digital Fault Recorders (DFRs) • The primary data recording requirements are for • Sequence of Events • Faults • Dynamic events • Other • Triggering of recording to be based on • frequency (f, df/dt, etc.) • Voltage, voltage deviation • Data output requirements with respect to simulation studies • Data requirements with respect to need to replay an event on a relay
NERC Disturbance Monitoring Standards Drafting Team MeetingAugust 7-9, 2007, West Palm Beach, Florida • Several presentations summarizing the regional disturbance monitoring programs • Regions covered : • ERCOT – Steve Myers • FRCC - Alan D. Baker • MRO – Larry Brusseau • NPCC - Jeff Pond • RFC - Barry Goodpaster and Bob Millard • SERC – Felix Amarh • SPP - Willy Haffecke • WECC - Bharat Bhargava • Most presentations / Regional groups consider the Digital Fault Recorders (DFRs) as the primary source of Disturbance Data collection • FRCC standards are being used to modify as the NERC standards • WECC is the only Region using Phasor Measurement Technology for Disturbance recording
NERC Disturbance Monitoring Standards Drafting Team MeetingAugust 7-9, 2007, West Palm Beach, Florida • During the presentations, Chairman (Navin Bhatt) noted issues which the drafting team should discuss and maybe incorporate into the revised Disturbance Monitoring standard: • Voltage level for locations • Current measurements - 3-phase and neutral or something else • Locations – siting methodology • Resolution (samples/second) • Data retention • Time stamping • Timing error and skew requirements • Generator location – should generator bus voltages be monitored • Recording duration • What is a “disturbance” • Data format • How to address legacy equipment • Remote triggering requirements • Would continuous recording requirements abrogate the need for remote triggering? • Team will need to establish BEST “common denominator” • Testing and maintenance requirements? • Sampling rate: What are the requirements for measurements points/cycle? • Okay to skip installation at a location when next station has a DME installed?
Southern California Edison Synchronized Phasor Measurement System and Programs
Increasing Transmission Capacity and reliability We can increase transmission capacity/reliability using SPMS by • Establishing static phase angle limits • Increasing loadings if margin is there • Reducing loading if the safe limits are exceeded • Comparing phase angle measurements with bench marked casesand keeping adequate dynamic margin • for critical outages • Maintaining adequate margins if line outages occur and adjusting phase angles as necessary. • Monitoring Modal oscillations frequencies and damping • Modal damping should not fall below 7 to 8 percent on any mode • Modal frequencies should not continue to drift lower • Monitoring voltage support at intermediate locations • when operating at large phase angles separations. • Event reconstruction and model validation
Critical system info for monitoring and controlling Western / other system grids Situational Awareness • Power system stress / phase angle separation • Inter-area dynamics (modes and their damping) • Remote abnormal operations and critical line outages • Var /voltage capability and voltage support at critical locations (Malin, Devers etc. ) • PV Curves and VAR management • Event system analysis and pattern recognitions • Identification of critical events • Active use of coordinated system controls on • Generators (PSS) • HVDC (modulation and operation) • FACTS devices and their coordination
SCE Phasor Measurement System Network Devers Kramer Mohave Alamitos Devers Antelope Big Vincent Songs 500kV Creek 3 500kV 230kV 500kV 230kV 115kV 66kV Magunden 230kV Valley Control 115kV 115kV Phasor Lugo Mira Loma Data 500kV 500kV Concentrator Eldorado 500kV Serrano 500kV PDC SCE Net User User User User NT 1 2 3 n Server
SCE Power System Outlook programCapabilities PSO Viewing capabilities • Voltage 500, 230, 115 and 66 kV • Currents on the monitored circuits • Power and reactive power • Power / Reactive power summation • Frequency and frequency deviation • Df/dt at all PMU locations • Phase angle difference from referenced bus • Percent deviation for voltage, current, Power, reactive power • Voltage Phasor replay
Power System Outlook programCapabilities PSO Analysis capabilities • Modes of oscillations • Damping of identified modes • Time constant for identified modes • Relationship analysis • Data extraction in to excel files • Power in specific frequency band (Time domain) • Power vector replay at PMU location • Viewing & Validation with GE PSLF simulated events • Power-Voltage and Power-angle curves – under progress with Dr. Chow of RPI • System summary – under development
Static and Dynamic phase angles from some recorded and simulated cases • 500 kV system events (WECC) • Phase Angle separation between Grand Coulee (BPA) and Devers (SCE) Date Static phase Dynamic phase Stability • angle angle swing Type • Aug. 10, 199694 deg. (Simul.) GrowingUnstable – dynamic • Aug. 4, 200092 deg.15 deg.Dynamic / stable • June 6, 200274 deg.73 deg.Transient / stable • July 15, 200282 deg.-35 deg.Transient / Stable • June 14, 200455 deg.90 deg.Transient / stable • April 20, 200686 deg.-10 deg.Transient / Stable • 230 kV system event (SCE Big Creek system) • Phase Angle separation between Big Creek and Vincent • Sept. 13, 200030 deg.15 deg.Dynamic / stable
Cal ISO file Plot for Alberta Separation July 24, 2006 at 15:25 PDT
Cal ISO file Plot for Alberta Separation July 24, 2006 at 15:25 PDT
Cal ISO file Plot for Alberta Separation July 24, 2006 at 15:25 PDTModes at Malin substation
Cal ISO file Plot for Alberta Separation July 24, 2006 at 15:25 PDTFFT Analysis at malin substation
SCE file Plot for Alberta Separation July 24, 2006 at 15:25 PDTPower flow on Midway-Vincent Path
Cal ISO file Plot for Alberta Separation July 24, 2006 at 15:27 PDTFFT Analysis at Vincent substation
Cal ISO file Plot for Alberta Separation July 24, 2006 at 15:25 PDTModes at Vincent substation
SCE file Plot for Alberta Separation January 23, 2007 at 13:44 PDTPower flow on Midway-Vincent Path
Cal ISO file Plot for Alberta Separation January 23, 2007 at 13:44 PDTFFT Analysis at Vincent substation
Cal ISO file Plot for Alberta Separation January 23, 2007 at 13:44 PDTModes at Vincent substation
Growing Oscillations observed on PaloVerde-Devers line at 8:46 AM on August 2, 2002
Frequency plot for three islanded areas in European system break-up of November 4, 2006
WECC System Oscillations from DC Probe tests – August 7, 2003 Probe Signal Injection at Big Eddy 230 kV
WECC System Oscillations from DC probing Tests- August 7, 2003Oscillatory modes and their damping at Big Eddy Substation
WECC System Oscillations from DC Probe tests – August 7, 2003 FFT of power flows at Big Eddy 230 kV
SCE Power System Outlook program Comparison of real and simulated events
WECC System Oscillations under stressed conditions – August 4, 2000500 kV Plots comparisonSimulation Real Event
WECC System Oscillations under stressed conditions – August 4, 2000FFT Plot of Power Flows at Malin Simulation Real Event
SCE Synchronized Phasor Measurement SMART Real-time Applications • Monitoring system stress (Phase angle separations) • Monitoring critical voltage support • Monitoring frequency and df/dt • Monitoring critical path loadings & generation • Monitoring dynamic power swings • Monitoring modal oscillations and modal damping • Integration with SCADA, EM & State Estimator systems • Real-time control such as on HVDC Modulation and FACTS devices • Alarms and triggers for stressed conditions • Monitoring machine excitation and governors • Voltage and reactive power management • AI and Pattern recognition tools for quick event analysis
SCE SMART program Showing July 24, 2006 eventat 22:28:30 GMT System frequency to 59.841 Hz momentarily and normal in six minutes when BPA Vantage-Hanford 500 kV Line relayed and approximately 1550 MW of generation tripped via remedial action scheme.
Screen Shot from SCE SMART program showing Voltage profile and frequency for July 24, 2006 event
Screen Shot from SCE SMART program showing voltage profile for July 24, 2006 event
Screen Shot from SCE SMART program showing Voltage deviation plot for July 24, 2006 event