Download
1 / 52
520 likes | 536 Views
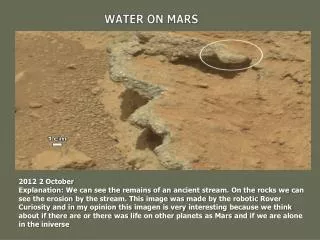
Explore the history of water on Mars through ancient climate studies and geological evidence revealing past liquid water presence. Understand the significance of valley networks, outflow channels, and groundwater interactions. Gain insight into the role of precipitation in shaping the Martian landscape.

E N D
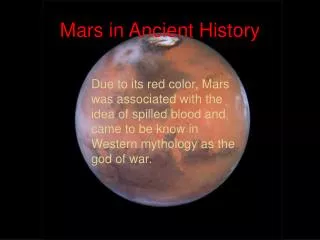
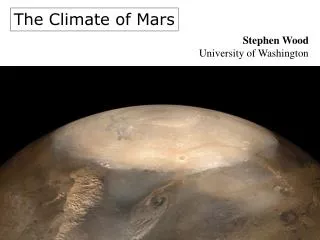
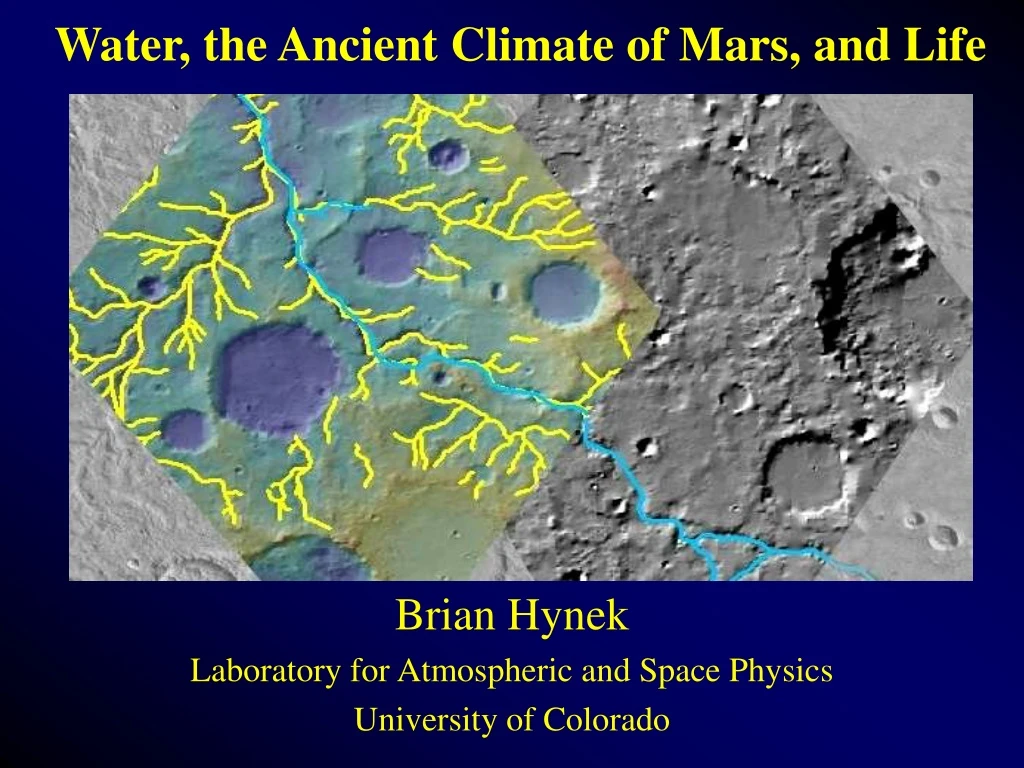
Water, the Ancient Climate of Mars, and Life Brian Hynek Laboratory for Atmospheric and Space Physics University of Colorado
Current Mars Atmosphere • Predominantly CO2 (~95%) • minor contributions from N2, Ar, H2O, O2, CO • Global mean temperature = 220 K • Atm pressure = 0.6% Earth (6 millibars) • this means that water isn’t stable; even in places where the temp gets greater than the freezing point • ~10 precipitable microns of water in the atm
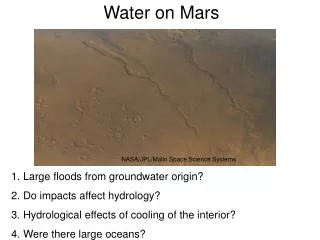
10 km Valley Networks (really old) * only one that requires a different climate than at present Evidence for Past Water Viking Orbiter image • The current thin, cold atmosphere prohibits liquid water from being stable on the surface. • However, there is ample evidence for past water • 3 flavors of flowing surface water: • Valley Networks (really old) • Outflow Channels (pretty old) • Gullies (really young) MOLA topography 500 km
Main evidence for a “warm and wet” ancient Mars • Valley networks • clear evidence of erosion by water • there has been a long standing debate over the importance of surface runoff vs. groundwater processes • more recent works show that precipitation was required to form many of the features • Widespread highland erosion (up to a km of crust lost) • Recently identified chemically weathered components of the crust (TES and OMEGA instruments) • hematite deposits in limited locales • sulfate deposits seen in many settings on Mars • clays (phyllosilicates) also detected • Mars Exploration Rovers show clear signs of groundwater interaction and possible signs of standing bodies of water
Some really convincing evidence of surface flow NE Holden Crater Delta MOC NA images
Amazonian (<3 Ga) Valley Networks Implication: 90% of VNs formed in the 1st billion years of the planet’s history.
Outflow Channels of Mars • Formed from catastrophic release of groundwater in mid to late martian history.
Did the Northern Lowlands Once Contain an Ocean? Northern plains Northern plains Tharsis Valles Marineris
Where did all the water go? • Deuterium/hydrogen ratios show that Mars (and Venus) lost most all of their water to space. • For Mars, the remaining water is tied up in the subsurface and polar caps Venus Ref: Owen and Bar-Nun, in R. M. Canup and K. Righter, eds., Origin of the Earth and Moon (2000), p. 463
Missions Greatly Improve Our Understanding of Mars • New data sets & improved resolution can vastly change our view of the planet’s history. One Example – The “Face” on Mars 2001 1976 Viking MOC
What have we learned about water on ancient Mars from recent missions? Specifically, can we determine the role of groundwater vs. surface runoff from precipitation?
Strahler [1958] stream order classification 1 1 1 1 1 2 2 2 1 1 2 downslope 3 3 * Higher stream order corresponds to more mature drainage systems and more contribution from surface runoff
Demonstration of Technique: Mapping Valley Networks with MOLA 128 pix/deg grid and MOC WA atlas (256 pix/deg) in ArcGIS (much of this could be done in GRIDVIEW) Create MOLA shaded relief Start with MOLA gridded data
Demonstration of Technique: Mapping Valley Networks with MOLA 128 pix/deg grid and MOC-WA atlas (256 pix/deg) in ArcGIS + OverlayMOC WA mosaic with some transparency MOLA shaded relief
Demonstration of Technique: Mapping Valley Networks with MOLA 128 pix/deg grid and MOC-WA atlas (256 pix/deg) in ArcGIS shaded relief + MOC WA Add a bit of MOLA color
Quantitative comparison of previous and new data for previous figure * Typical terrestrial values determined in a similar manner range from 6.5 × 10⁻² km-1 to 2.09 × 10⁻¹ km-1 [Carr & Chuang, 1997]
Comparison of old and new data MGS data and newly recognized VN Viking MDIM and Carr VN
Previously mapped unconnected valleys (blue) are now recognized as an integrated drainage system (yellow). Newly recognized VN from MGS Carr VN on Viking base
Numerous VNs head near divides Centered near 1ºS, 22ºE
Conclusions • Combination of MGS data sets provide vast improvement in image clarity and resolution with the added bonus of topographic information. • Using the same defining characteristics for VN as Carr [1995] our mapping reveals an order of magnitude increase in the number of valleys, total valley length, and drainage density over large sections of the highlands. • MGS data show that many previously mapped unconnected, low order segments, are part of larger integrated, mature drainage networks (multiple >5th order systems).
Implications for Early Climate • Newly calculated drainage densities are comparable to terrestrial values derived in a similar manner [Carr and Chuang, 1997]. • Surface runoff is the simplest explanation for: • integrated, mature drainage basins • valley heads near the top of divides • high stream order • drainage densities comparable to terrestrial values
The obvious next step: look at higher resolution data (THEMIS and MOC NA)
medial ridge older, degraded channel system different flow paths
THEMIS day IR + MOLA 5N, 33E
Carr and Malin, 2000 (Icarus) 11 km across 18 km across 2 rare examples of MOC NA showing highly dissected VNs
Resolution and Data Sets ~240 & ~460 m/pix ~100 & ~460 m/pix ~19 m/pix ~3 m/pix ~240 m/pix THEMIS VIS MOC WA + MOLA THEMIS IR + MOLA MOC NA Viking • Valley network identification increases up to a point. • Beyond that cutoff (~50 m resolution), few additional valleys are seen. • Why? • 2 choices: Small VNs did not form or they were erased. • Give terrestrial experience, the latter is preferred through resurfacing from impact gardening, mass wasting, aeolian erosion/deposition, volcanic lavas and ash, etc., have likely obscured or removed many first order segments and tributaries of this scale. very few more up to another factor of 2-4 very few more few valleys 5-15 times more
Conclusion: Multiple episodes of precipitation-fed runoff is the only plausible way to explain these features.
What about life on Mars??? • Mars has all the necessary ingredients for life (judging from our terrestrial experience) • Water, an energy source, and the basic elements and compounds required make life. • Mars likely had a very different climate in the past that was more hospitable. • Life on Earth is exceptionally tough!
Examples of Extreme Life: Zygogonium sp. Zygogonium is a type of filamentous green algae that lives in really hot, acidic water! (this and the following 3 slides from Lynn Rothschild)
Life can flourish in cold environments too! Example: Lakes under ice in Antarctica under Lake Hoare preparing to dive under Lake Hoare mat layers microbial mat
Deinococcus radiodurans (Conan the Bacterium) • An example of survival in extreme radiation environment • Can withstand 1,500,000 “rads” • 500 rads kill humans!
Type Hyperthermophile Thermophile Mesophile Psychrophile Barophile Piezophile Xerophile Halophile Alkaliophile Acidophile Anaerobe Miroaerophil Aerophile Definition growth >80°C Growth 60-80°C Growth 15-60°C Growth <15°C Weight loving Pressure loving Cryptobiotic; anhydrobiotic Salt loving (2-5 M NaCl) pH >9 Low pH loving Cannot tolerate O2 high CO2, arsenic, mercury Examples Pyrolobus fumarii -113°, Geobacter-121° Synechococcus lividis humans Psychrobacter, insects D. radiodurans Shewanella viable at 1600 MPa Haloarcula, Dunaliella Spirulina, Bacillus firmus OF4 (10.5); 12.8?? Cyanidium, Ferroplasma Methanococcus jannaschii Clostridium Homo sapiens Cyanidium caldarium tardigrades Categories of extremophiles Environment Temperature Radiation Pressure Desiccation Salinity pH Oxygen tension Chemical extremes Vacuum Electricity
Extremophile Lab: The Great Sea Monkeys * idea modified from David E. Trilling, Univ. of Arizona