Download
1 / 22
220 likes | 534 Views
Household Income and Expenditure 2012 Household Budget Survey. By Sanjev Bhonoo 18 November 2013. Household Budget Survey 2012. Survey on private non-institutional households conducted in Mauritius and Rodrigues Period : January to December 2012 6720 households surveyed

E N D
Household Income and Expenditure 2012 Household Budget Survey By Sanjev Bhonoo 18 November 2013
Household Budget Survey 2012 • Survey on private non-institutional households conducted in Mauritius and Rodrigues • Period : January to December 2012 • 6720 households surveyed • Main data items: income and expenditure • Conducted every 5 years to take account of the changes in the consumption pattern of the population (ILO recommendation)
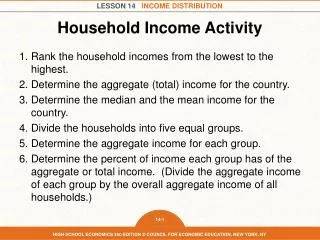
Objectives of the Household Budget Survey • Determine the content of Consumer Price Index (CPI) basket • Estimate weight (importance) of each item in the basket • Distribution of household income and expenditure • Poverty analysis and other analyses
CPI basket of goods and services • The Consumer Price Index (CPI) is a measure of changes over time in the general level of prices of goods and services, which the private consumer buys • The CPI basket is based on the expenditure pattern of households during a specific period • The weight is the relative importance of each item in the basket with respect to the expenditure
Major changes in weight by selected division 2001/02, 2006/07 & 2012
Household Disposable Income, 2012 • Avg. monthly household disposable income was Rs 29,360 • The average household size was 3.5 • There were 2 income earners per household
Household disposable income composition, 2012 • Income from paid employment is the major source of household income • Property income has a negligible share of total income
Household Consumption Expenditure, 2012 • Average monthly household expenditure was Rs 23,930 in 2012
Profile of households in lowest and highest income deciles, 2012
Income inequality, 2012 • Gini coefficient = 0.413 (0 – complete equality, 1 – complete inequality)
Share of household income, 2012 • The highest 10% of households received some 30% of the total income, while the lowest 10% of households received only some 2% of the total income
Evolution of household income and expenditure, 2001/02 to 2012
Distribution of household income, 2001/02 to 2012 • The graph for 2012 is more flattened compared to that of 2001/02 and 2006/07, indicating a spread in the income distribution • The household deriving high income has increased, e.g., 13% of households had an average monthly income of Rs 50,000 or more in 2012 compared to only 2% ten years back
Trends in income inequality - Gini coefficient, 2001/02 to 2012 A higher Gini coefficient over the past 10 years indicates income inequality is on the rise The further away the curve is from the equality line, the larger is the Gini coefficient, i.e. higher income inequality.
Trends in income inequality - income share, 2001/02 to 2012 Income share for lowest 20% of households Income share for highest 20% of households