Download
1 / 14
150 likes | 179 Views
Explore various types of sampling methods and testing procedures in statistical control, including hypothesis testing and confidence intervals. Learn how to determine sample size and conduct statistical tests effectively.

E N D
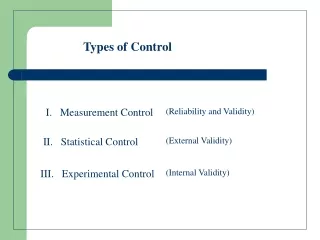
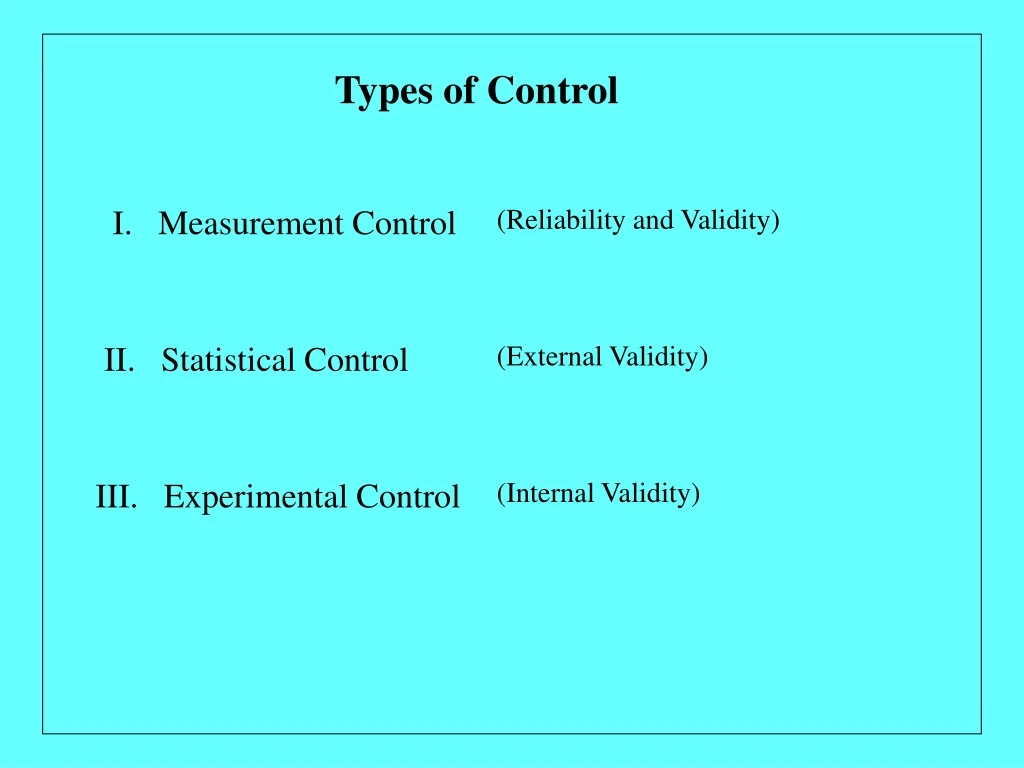
Types of Control I. Measurement Control (Reliability and Validity) II. Statistical Control (External Validity) III. Experimental Control (Internal Validity)
Statistical Control - Sampling I The Vocabulary of Sampling II Types of Samples III Testing Samples IV Determining Sample Size
Statistical Control - Sampling I. The Vocabulary of Sampling • A. The Universe (The Theoretical Concept) • B. The Population (The Indicator Concept) • C. The Sampling Frame (The Operational Procedure) • D. The Sample (The Observational Set)
Statistical Control - Sampling II. Types of Samples • A. Non-Probability • B. Probability
Statistical Control - Sampling II. Types of Samples • A. Non-Probability (Good for Exploratory Research) 1. Convenience Sampling 2. Referral Sampling 3. Quota Sampling
Statistical Control - Sampling II. Types of Samples • A. Non-Probability • B. Probability (Good for Explanatory Research) 1. Simple Random Sample 2. Systematic Random Sample 3. Stratified Random Sample 4. Cluster or Area Sample
Statistical Control - Sampling III. Testing a Single Sample Mean A. The Central Limit Theorem - When random samples of Size N are repeatedly taken from a population (no matter what shape the population is, the resulting sampling distribution of means is normal in shape with a mean equal to the population mean and a standard deviation equal to the population S.D. divided by the square root of N. B. The Normal Curve
Statistical Control - Sampling III. Testing Samples (cont.) - Hypothesis Testing: • A. State the Hypotheses • The Null Hypothesis (i.e. Ho) • The Alternative or Research Hypothesis (i.e. Ha) B. Specify the Distribution (e.g. Normal Distribution) C. Set the Decision Criteria Type I error – Alpha or Critical Region D. Calculate the Outcome (e.g. determine Z-value) E. Make the Decision Reject Ho or Do not Reject Ho
Statistical Control - Sampling III. Testing Samples (cont.) - Single Sample Statistical Tests The z-test is called for when both the population mean and variance are known and a point (mean value) is being evaluated Example The t-test is called for when the mean, but not the population variance, is known and a point (mean value) is being evaluated. Example Confidence Intervals are used when neither the mean nor variance of the population are known and an interval estimate is being evaluated. Example
Statistical Control - Sampling IV. Sample Size (Three Components) A. Error in Prediction B. Confidence Level C. Variability in Population Click here to see formulae
Determining Sample Size Consider the confidence interval Solving for the sample size N we get If Then Observe now the three parentheses that define N: 1) our confidence level (z); 2) the population variance; and 3) the margin of error. Back to Beginning End Presentation
Single Sample z-test Problem: Suppose you want to test the idea that CSUN student GPAs are higher this year than in the past. If records indicate that the past GPA is 2.50 with a S.D. of .5, can you conclude that a sample of 25 students, whose GPA is 3.00, is significantly higher? Solution: Use the five step hypothesis testing procedure Step 1 State the hypotheses: Ho: = 2.50 H1: > 2.50 Step 2: Specify the distribution: Normal (Z-distribution) Step 3: Set alpha (say .05; one tail test therefore Z= 1.65) = .5/.1 = 5.0 Step 4: Calculate the outcome: Step 5: Draw the conclusion: Reject Ho: 5.0 > 1.65 Students have a better GPA today. Back
Single Sample t-test Problem: Given historical data, documenting the time it takes students at CSUN to complete the undergraduate degree, yields an average of 6.5 years. Could you conclude that students this semester take significantly longer to graduate if your sample of 64 students this semester, yields a mean of 7.5 years, with a unbiased standard deviation of 1.6 years? Solution: Use the five step hypothesis testing procedure Step 1 State the hypotheses: Ho: = 6.50 H1: > 6.50 Step 2: Specify the distribution: Student’s t-distribution Step 3: Set alpha (say .05; one tail test; therefore since N>30, t= 1.65) = 1.0/.2 = 5.0 Step 4: Calculate the outcome: Step 5: Draw the conclusion: Reject Ho: 5.0 > 1.65 Students today take longer. Back
Confidential Intervals Problem: Suppose you reject the null hypothesis in the z-test example and now do not have a specific value of the population to use. Can we estimate an interval within which we can be a certain degree assured that the actual population falls? Solution: Construct a confidence interval to estimate the population mean. If the formula for the z-test is: Then solving for the population mean we get the following: Thus, in the previous example the 95% confidence interval would be: Thus, we can be 95% sure the true population mean falls between the values 2.804 and 3.196 Back